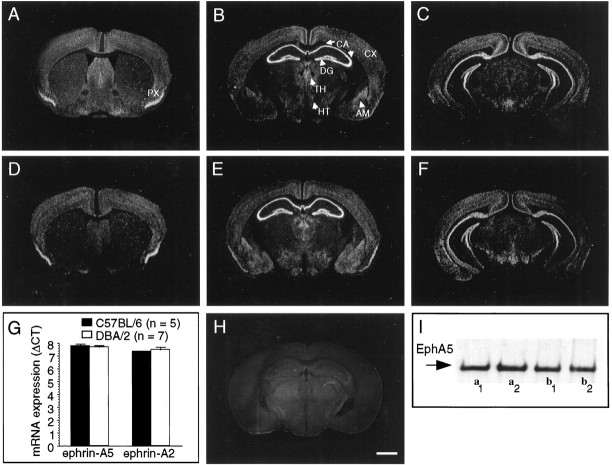
Fig. 1.
The EphA5 receptor and its ligands are expressed in the adult mouse hippocampus. In situ hybridization (coronal sections with antisense probe) for EphA5 mRNA expression in the brain of C57BL/6 (A–C) and DBA/2 (D–F) strains of mice. A section with sense (control) probe (H) is also shown. Approximate position of sections from bregma are (in mm):A, D, +0.75; B,E, H, −2.10; C,F, −3.00. Both C57BL6 and DBA/2 mice display prominent expression of EphA5 mRNA in hippocampus and dentate gyrus. Scale bar (in H), 1000 μm. CA, CA1–CA3 areas of the hippocampal formation; DG, dentate Gyrus;CX, cortex; TH, thalamus;HT, hippothalamus; AM, amygdala;PX, piriform cortex. G, Ephrin-A5 and -A2 ligands are expressed in the hippocampus of both inbred strains of mice analyzed. Real-time quantitative (TaqMan) RT-PCR for mRNA of ligands ephrin-A5 and -A2 in the hippocampi of C57BL/6 (black bars) and DBA/2 (white bars). The data (mean ± SEM) are based on the number of PCR amplification cycles required to reach a threshold level (cycles to threshold,CT) of cleavage of a fluorescent reporter probe (Gibson et al., 1996; Heid et al., 1996) and are normalized to GAPDH housekeeping gene transcript (ΔCT). Sample sizes (n) indicate the number of mice analyzed. Note that larger values mean smaller original mRNA amount in the hippocampal tissue sample. Also note that amplification characteristics are unique to each gene; therefore, comparison from one gene to another is not valid. I, Western blot for phosphorylated EphA5. Each lane represents a hippocampal tissue sample from an individual mouse. Both DBA/2 (a1, a2) and C57BL/6 (b1, b2) strain of mice exhibit a prominent signal.

