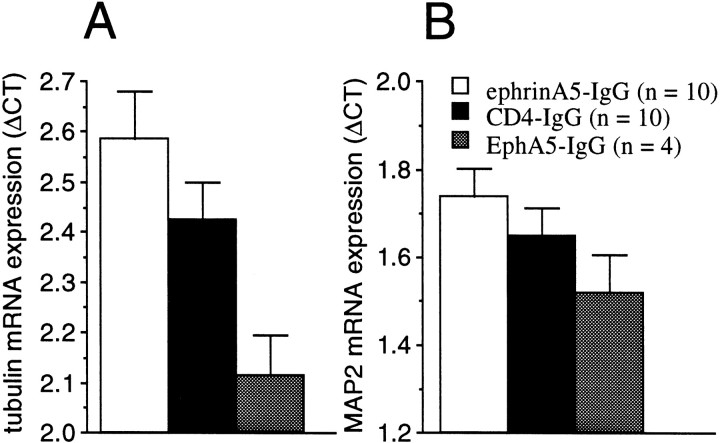
Fig. 9.
Transcriptional changes induced by immunoadhesins in two cytoskeletal proteins, tubulin (A) and MAP2 (B). No strain differences were found. The data (mean ± SEM) are pooled for the strains and are based on the number of PCR amplification cycles required to reach a threshold cleavage level of fluorescent reporter probe18, 19. Results normalized to GAPDH housekeeping gene transcript are shown (ΔCT). Sample sizes (n) are also indicated. Note that larger values represent smaller original mRNA amount in the hippocampal tissue sample analyzed. Note that expression of tubulin mRNA is increased by EphA5-IgG and decreased by ephrinA5-IgG infusion (ANOVA; F(2,21) = 5.02; p < 0.02). Expression changes in MAP2 show a similar but nonsignificant trend (ANOVA;F(2,21) = 1.75; p> 0.19).

