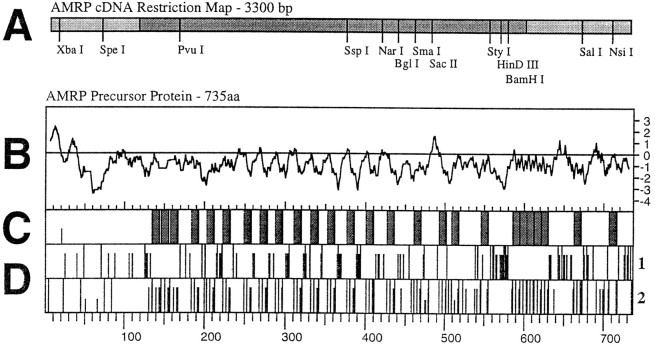
Fig. 3.
Organization of the AMRP precursor.A, Scale drawing of a partial restriction map of the AMRP precursor mRNA. Open reading frame is shown in a darker shade of gray. B–D are scale drawings comparing different aspects of the AMRP precursor protein.B, Kyte–Doolittle hydropathy plot of the AMRP precursor protein. The initial hydrophobic upward deflection denotes the signal peptide. C, The distribution of the predicted amidated peptides shown as gray bars. Connecting peptides are shown as the intervening white regions.Half-height line denotes position of predicted signal peptide cleavage. D, Distribution in the AMRP precursor of acidic (D1) and basic (D2) residues shown as vertical lines. For acidic residues (D1), full height lines represent glutamate residues, and two-thirds-height linesrepresent aspartate residues. For basic residues (D2), full height lines represent arginine residues, two-thirds-heightlines represent lysine residues, andone-third-height lines represent histidine residues. Note acidic nature of the connecting peptides and basic residues flanking the predicted amidated peptides. For comparison, scale is identical in parts B–D with amino acids numbered atbottom.

