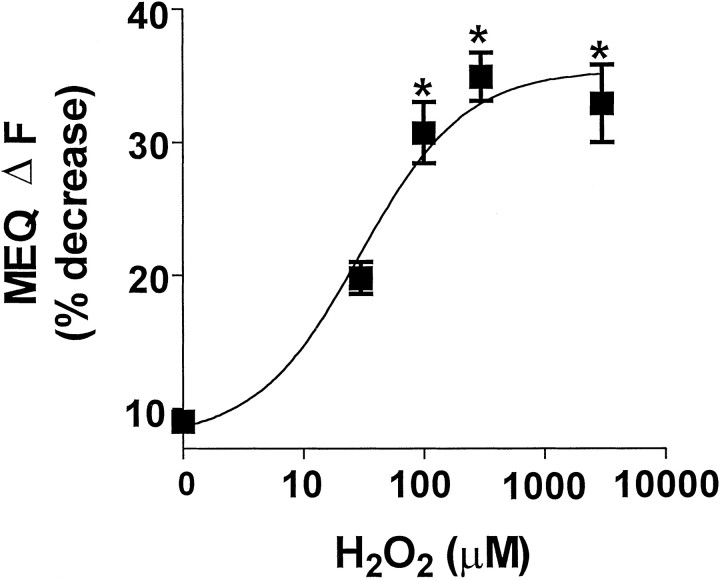
Fig. 2.
Concentration-dependent decrease in MEQ fluorescence by H2O2. MEQ-loaded slices were exposed to increasing concentrations of H2O2. The change in MEQ fluorescence (ΔF) was calculated as percent of baseline fluorescence for individual cells after 10 min of H2O2. Data are from 6–25 cells from at least three slices per condition. *p < 0.05 versus control; ANOVA and Tukey's post hocanalysis.

