
Fig. 4.
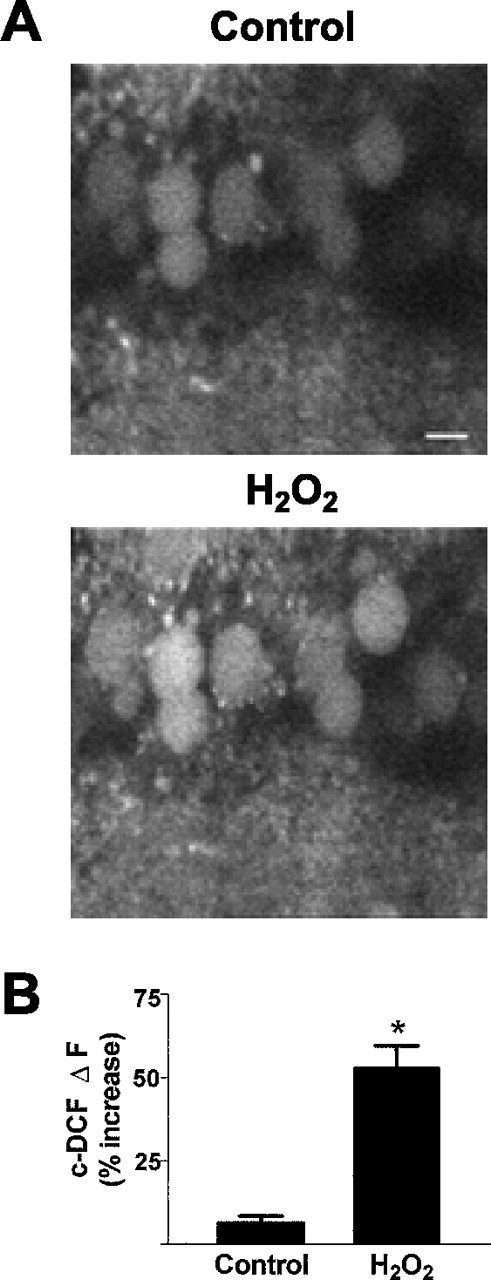
Increased c-DCF fluorescence in cells after 10 min H2O2, indicating elevation of ROS.A, Confocal video images of c-DCF fluorescence in area CA1 pyramidal cell soma before (Control) and after H2O2 superfusion. Scale bar, 20 μm.B, Changes in c-DCF fluorescence after 10 min H2O2. Control bar represents the baseline drift of c-DCF fluorescence in cells not exposed to H2O2 under identical experimental conditions. Data are mean ± SEM values of 12–22 cells from three to five slices. *p < 0.05 versus control; Student'st test.