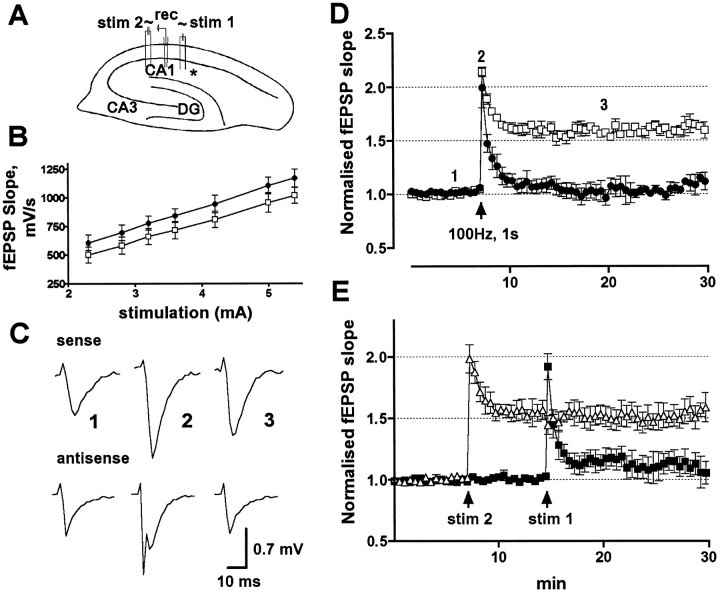
Fig. 4.
fEPSPs recorded from a single site in response to alternately delivered stimuli to two separate inputs from control versus experimental slices after GluR2(B) hippocampal knockdown.A, Cross section showing stimulating (stim 1 and stim 2) and recording electrode (rec) arrangements in respect to the infusion site (asterisk). B, Averaged input–stimulus/output–response relationship (input/output curve) in GluR2(B) AS-ODN (circles) and control (squares) slices. C, Field synaptic responses in sense and antisense knockdown slices obtained before (1), immediately after (2), and 13 min after (3) the high-frequency train of stimuli. Note that the immediate post-tetanic trace from knockdown slices reveals a population spike over the fEPSP. D, Normalized fEPSP slope changes in GluR2(B) AS-ODN (●) and control (■) slices show impairment of tetanic LTP in CA1 averaged from both sites; arrow indicates time of tetanus.E, fEPSP recorded from a representative animal that did not exhibit seizure behavior. First and second tetanic stimulations (arrow) were delivered to inputs near (▪) and distal (▵) to the infusion site.

