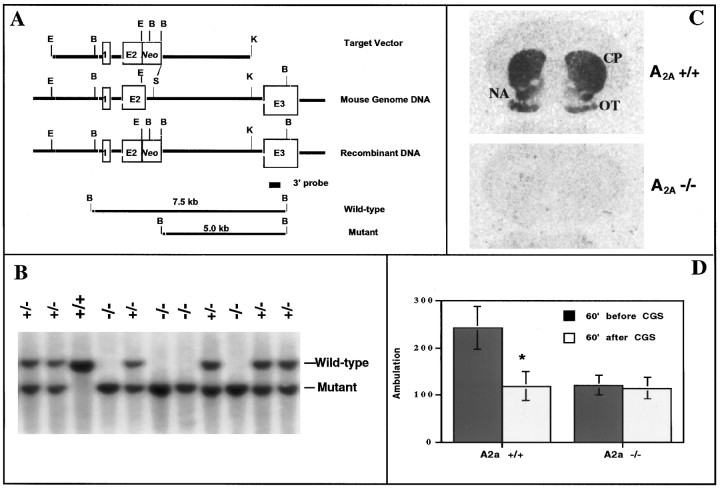
Fig. 1.
Generation of A2A KO mice with target inactivation of the A2A receptor.A, Schematic diagram of the A2A receptor targeting vector; a standard replacement-type vector was constructed with 5 and 4.5 kb A2A receptor genomic fragments split by a positive selection marker (Neo cassette), which replaced the 3′ end of exon 2 (E2) and the adjacent 5′ splice junction and intron sequences. Digestion of wild-type and mutant A2A receptor genes with BamHI (at sites labeled B) generates 7.5 and 5.0 kb fragments, respectively, that can be distinguished using a nonoverlapping 3′ probe (as in B). B, Genomic Southern analysis of WT (+/+), heterozygous (+/−), and homozygous (−/−) mice with respect to the A2A receptor gene was performed as described in Materials and Methods, using the 3′ nonoverlapping probe illustrated in A. WT mice displayed a single 7.5 kb band, whereas homozygous A2A KO mice showed a single 5.0 kb band corresponding to the restriction fragments for WT and mutant alleles, respectively. Heterozygous mice showed both 7.5 and 5.0 kb bands.C, Homozygous A2A receptor KO mice are defi-cient in A2A receptors detected by receptor autoradiography; A2A receptor binding was determined using3H-CGS 21680 as a ligand. A representative coronal brain section from a WT mouse shows specific labeling of A2Areceptors in striatum (caudate putamen, CP; nucleus accumbens, NA) and olfactory tubercle (OT), whereas that from a homozygous mouse shows no 3H-CGS 21680 binding. D, Behavioral responses to the A2A agonist CGS 21680 in WT and A2A KO mice; ambulation was measured in WT and A2A KO mice (n = 14–16) before and after challenge with CGS 21680 (0.2 mg/kg, i.p.) by recording contiguous photobeam interruptions (ambulation) for 60 min. Error bars represent the mean ± SEM. *p < 0.05 (Student's t test) when compared with ambulation in the WT mice before treatment.

