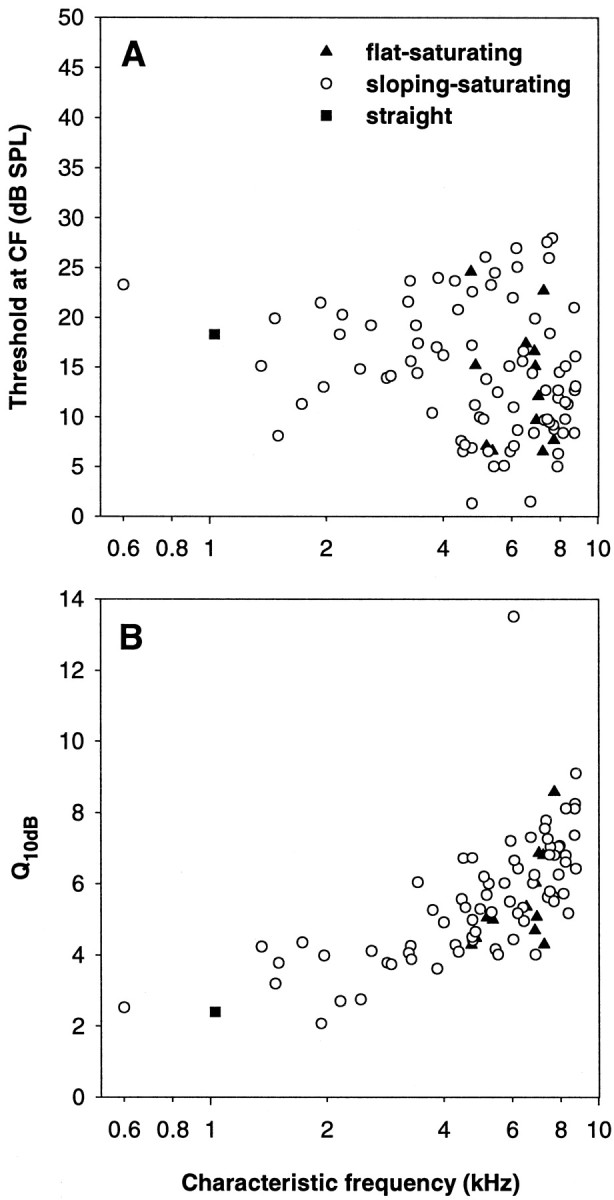
Fig. 2.

Sensitivity (A) and tuning sharpness (B) as a function of characteristic frequency, of the sample of auditory nerve fibers in this study. The different symbols refer to the classification of the fibers into different types of rate–intensity function, as indicated inA.
