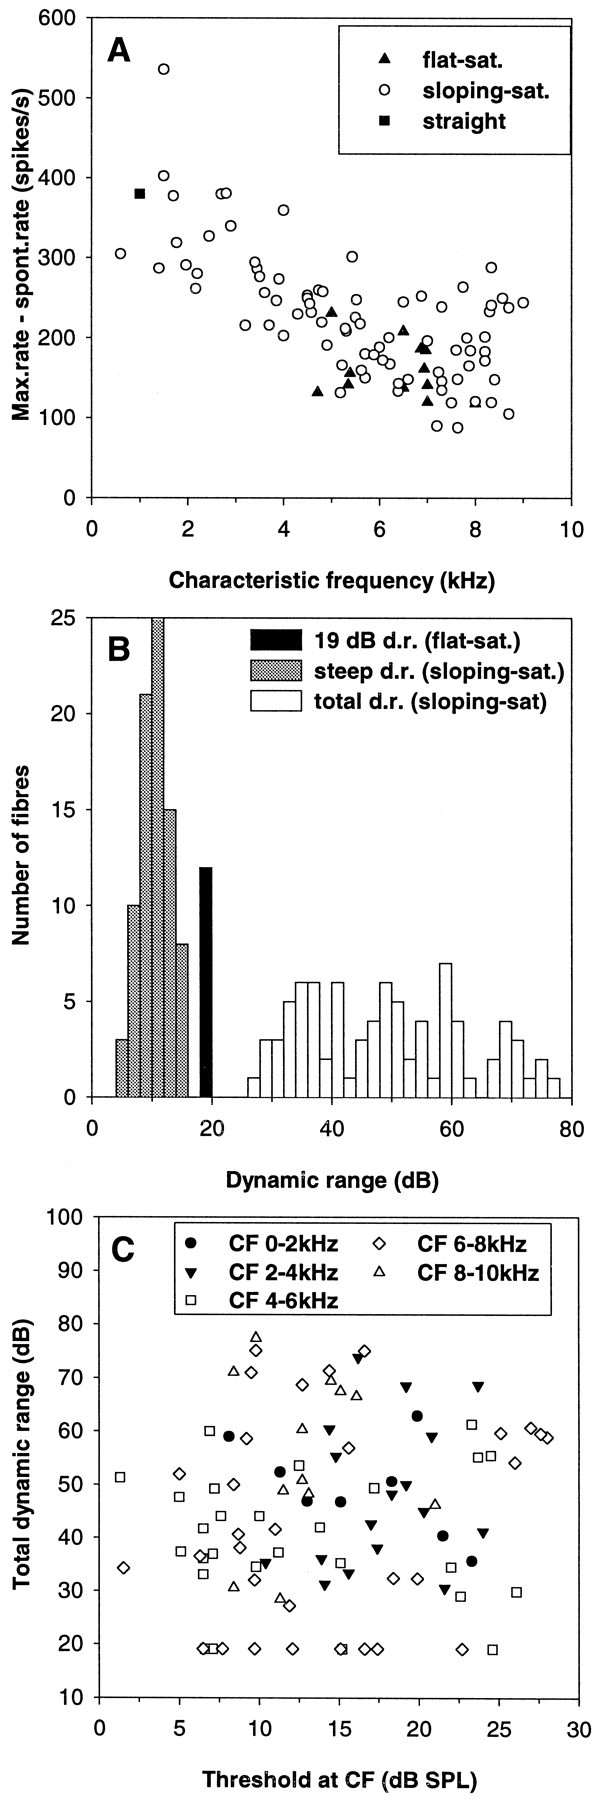
Fig. 4.

Dynamic ranges of auditory nerve fibers at their characteristic frequency. A, The difference between maximal rate and spontaneous rate as a function of characteristic frequency. Note the prominent decline from low to high frequencies. The different symbols refer to the classification of the fibers into different types of rate–intensity function, as indicated. B, Frequency histogram for two different measures of the dynamic range in decibels.Gray columns indicate the initial steep dynamic range of sloping–saturating rate–intensity functions, and white columns indicate their total dynamic range. Flat–saturating responses had a simple and invariant dynamic range of 19.1 dB and are represented by the black bar. C, Total dynamic range as a function of the threshold at CF. Note that there is no relation between those parameters. Different symbols distinguish data from fibers of different CF ranges, as indicated.
