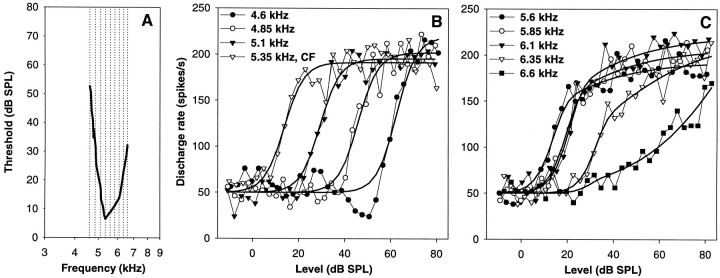
Fig. 5.
Rate–intensity functions of a single auditory nerve fiber with a CF of 5.35 kHz, at different stimulation frequencies. A, Frequency–threshold curve of the fiber (thick line), with the stimulation frequencies used inB and C indicated by thin dotted lines. B and C, Raw data (symbols joined by thin lines) and best fits (thick lines). Different symbols are used for different frequencies, as indicated. B shows stimulation frequencies up to and including the CF, and C shows frequencies above the CF. This fiber showed a flat–saturating response up to and including CF. At frequencies above CF, the response became increasingly pronounced sloping–saturating, at 6.6 kHz it classified as straight. Also note the pronounced suppression below the level of spontaneous discharge at 4.6 kHz, which was not well fit.

