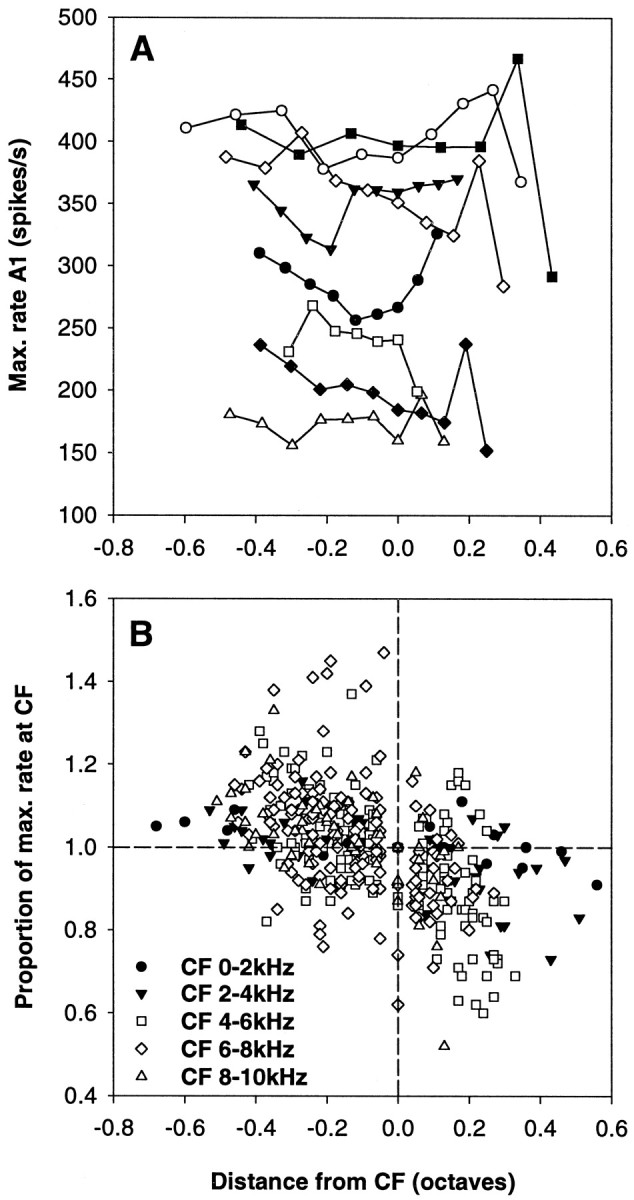
Fig. 9.

Variation in the maximal discharge rates across the frequency response range of individual auditory nerve fibers.A, Maximal discharge rate predicted by the best fits (parameter A1) as a function of the distance from the CF in octaves. The different symbols indicate data from different individual fibers. Note that there was often a mild decline in maximal rate with increasing frequency or a dip around CF. B, Maximal discharge rates actually observed up to the maximal sound pressure levels used. Discharge rates are plotted normalized to the rate at CF, as a function of the distance from the CF in octaves. All data are shown, and different symbols are used to distinguish data from fibers of different CF, as indicated. The dashed lines provide references, indicating the values at CF. Note that maximal rates at frequencies below CF tended to be higher than at CF, whereas, conversely, rates at frequencies above CF tended to be lower than at CF. The decline of maximal rates at frequencies above CF is largely caused by the many responses of the straight type, showing a very slow increase in discharge rate with increasing sound pressure level.
