
Fig. 2.
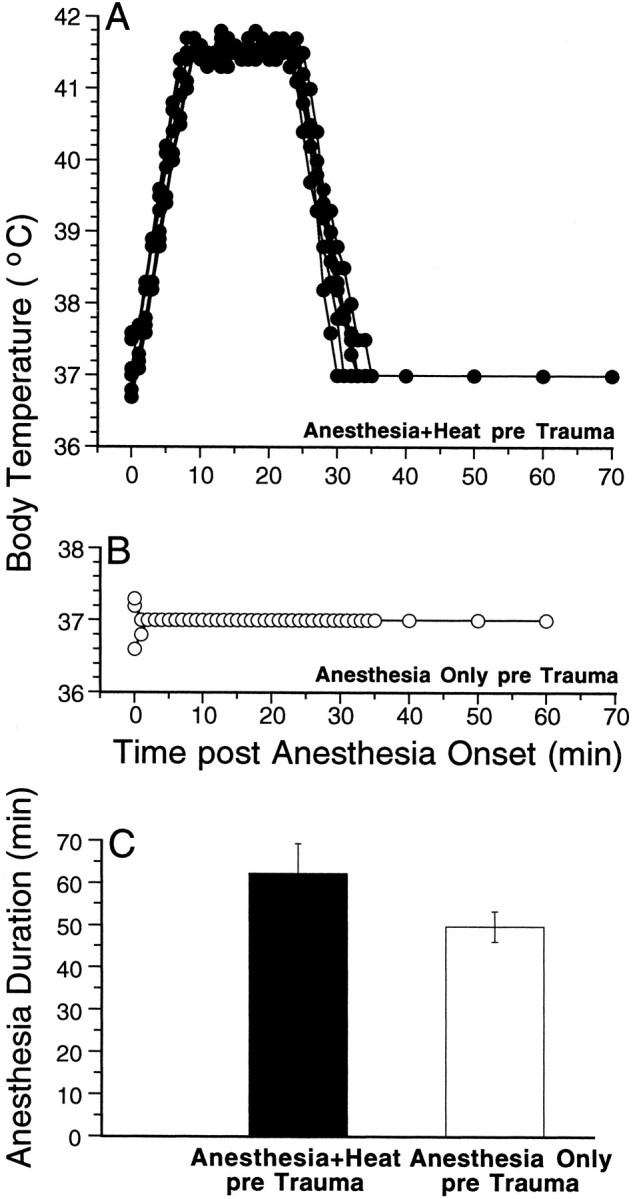
Temperature records during anesthesia are shown for one group of Anesthesia+Heat pre Trauma animals (A) and for the Anesthesia Only pre Trauma group (B); the mean ± SEM durations of anesthetization for the same two groups of animals are shown in C. For each animal, a rectal thermometer was inserted as soon as possible after injection of anesthetics and was removed only when the anesthesia began to wear off and the animal began to move. During heat stress, the temperature was read every minute under computer control (accuracy better than 0.1°C); after anesthesia plus heat or during the anesthesia only protocol, temperature was read by eye off a meter (to the nearest 0.25°C). TheAnesthesia+Heat pre Trauma group shown inA was the one with the shortest treatment–trauma interval (6 hr).