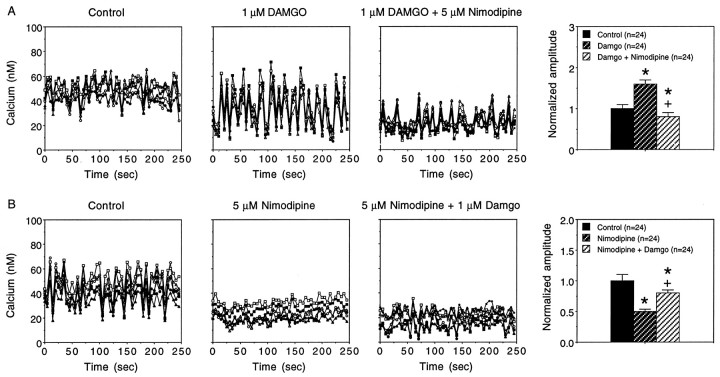
Fig. 4.
Effect of nimodipine on the modulation of intracellular Ca2+ oscillations by DAMGO.A, Representative recordings of intracellular Ca2+ oscillations under baseline control conditions, in the presence DAMGO, and after the addition of the L-type channel Ca2+ blocker nimodipine to the bath saline. Recordings are from different microscopic fields in the same culture dish; five neurons are shown for each condition. Nimodipine blocked the enhanced intracellular Ca2+ oscillations produced by DAMGO. Mean values ± SEM for the amplitude of the intracellular Ca2+ oscillations (peak to trough measurement) in a population of neurons under the same conditions as the representative recordings (same culture dish as representative recordings) are shown to the right. B, Representative recordings of intracellular Ca2+ oscillations under baseline control conditions, after the addition of the L-type channel Ca2+ blocker nimodipine to the bath saline, and after the subsequent addition of DAMGO to the bath. Recordings are from different microscopic fields in the same culture dish; five neurons are shown for each condition. Nimodipine blocked baseline intracellular Ca2+ oscillations and reduced the enhancement of the oscillations by DAMGO. Mean values ± SEM for the amplitude of the intracellular Ca2+ oscillations (peak to trough measurement) in a population of neurons under the same conditions as the representative recordings (same culture dish as representative recordings) are shown to the right. In the graphs of mean values the amplitudes of the intracellular Ca2+oscillations in the various treatment groups were normalized to the mean amplitude under baseline control conditions. *Significant difference from control values (p > 0.05; ANOVA). +, Significant difference from DAMGO for DAMGO/Nimodipine; Nimodipine for Nimodipine/DAMGO.

