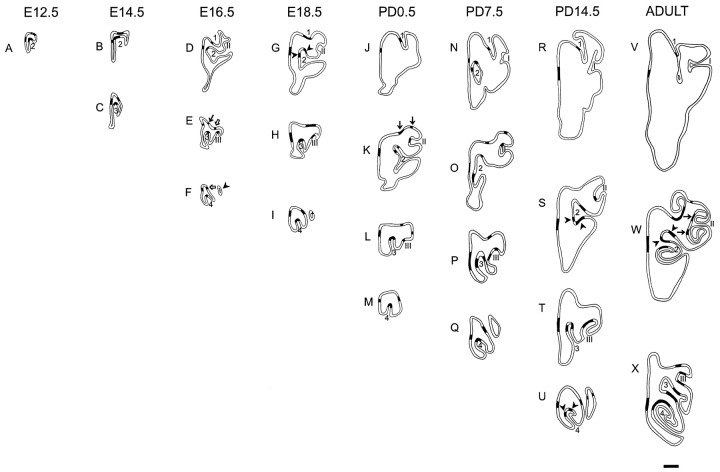
Fig. 1.
Camera lucida images detailing the distribution of P2 neurons in the olfactory neuroepithelium at different rostrocaudal levels. Cryostat sections were stained using X-gal histochemistry, and sections were chosen based on morphological detail. Regions of P2 expression were demarcated by black bands on camera lucida drawings. Each age is represented by the right nasal cavity only. Scale bar, 500 μm. 1, 2,3, and 4 refer to ectoturbinates 1, 2, 3, and 4, respectively; I, II, andIII refer to endoturbinates I, II, and III, respectively.

