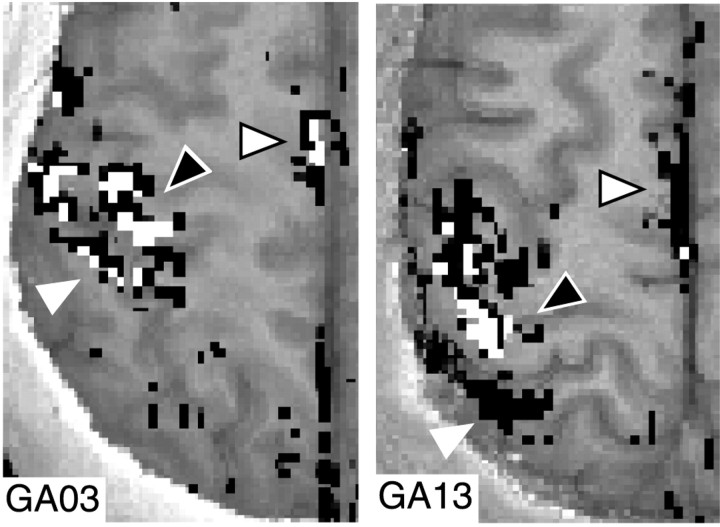
Fig. 4.
Spatial distribution for gaze-independent and gaze-dependent voxels. Exemplar activation patterns from two participants (one slice each in left and right panels), illustrating the intermixing of gaze-independent and gaze-dependent voxels across brain regions. Voxels indicated inwhite correspond to gaze-independent, and those inblack correspond to gaze-dependent. White triangle indicates the interparietal sulcus; white triangle with a black outline indicates SMAc;black triangle with white outlineindicates MIc.

