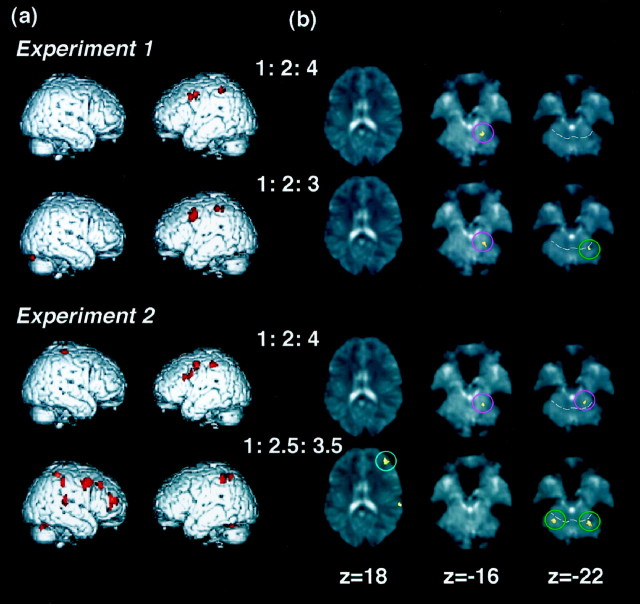
Fig. 3.
Statistical parametric analysis. a, Statistical parametric maps (SPM{z}) of the six subjects when 1:2:4, 1:2:3, and 1:2.5:3.5 rhythms were respectively compared with control. The foci of significantly increased activities were rendered onto the surface template of the standard brain as implemented in SPM96 (Welcome Department of Cognitive Neurology, London, UK) and are shown in red. b, Activation foci ina are shown in three slices at 18 mm above (left), 16 mm below (middle), and 22 mm below (right) the level of the AC-PC line; the prefrontal cortex (blue circle), cerebellar anterior lobe (pink circle), and cerebellar posterior lobe (green circle). White dotted linesin the cerebellum indicate the primary fissure that separates the anterior and posterior lobes of the cerebellum. Theright corresponds to the right hemisphere.

