
Fig. 4.
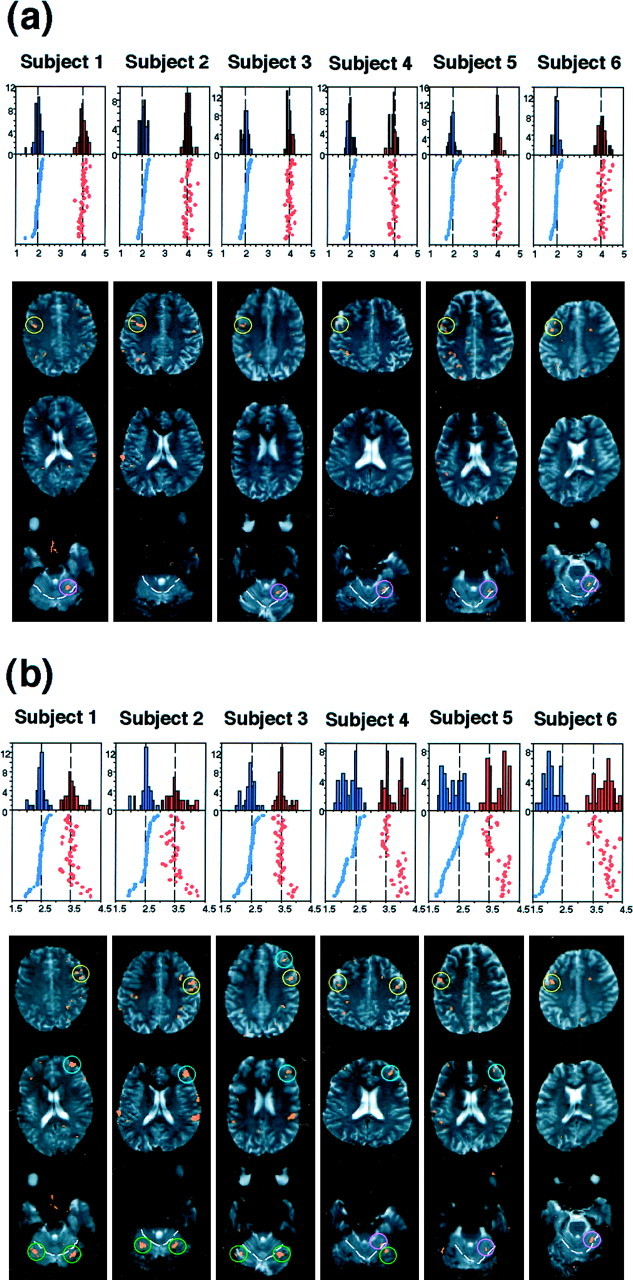
Individual subject analysis. The distribution of the interval ratios of the reproduced rhythms, shown as histograms and rasters. Data are shown for 40 trials of 1:2:4 (a) and 1:2.5:3.5 (b) rhythms in experiment 2. Abscissa of the histogram and raster represents the reproduced ratio. The smaller ratios are shown inblue, and larger ratios are shown in red. For the raster display, trials have been sorted such that the smaller ratios are arranged in the decrementing order from topto bottom. The ratios for the presented rhythms are indicated by the two vertical dotted lines. The activation maps for each subject are shown in three slices in which significant activations are shown in orange. Theright corresponds to the right hemisphere. White dotted lines in the cerebellum indicate the primary fissure.a, Activation pattern for 1:2:4 rhythm. The left premotor cortex (yellow circle) and the right cerebellar anterior lobe (pink circle) were consistently active, except for subject 2. b, Activation pattern for 1:2.5:3.5 rhythm. Note the difference in the ratio distribution and activation patterns across the subjects. For the premotor cortex (yellow circle), the right side was active in subjects 1–4, whereas the left side was active in subjects 5 and 6. The prefrontal cortex (blue circle) was active in subjects 1–5, most prominently in subjects 1 and 2. The cerebellar posterior lobe (green circle) was bilaterally active in subjects 1–3, whereas the right cerebellar anterior lobe (pink circle) was active in subjects 4–6.