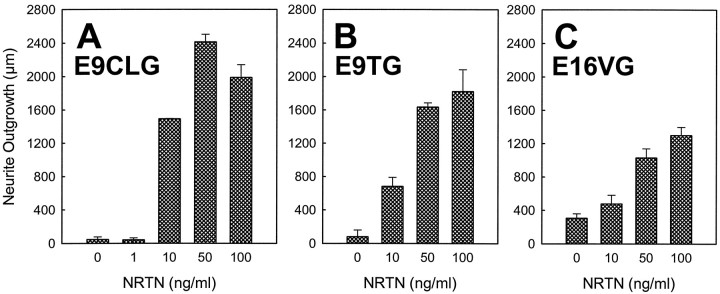
Fig. 3.
Dose–responses of the E9 ciliary (A), E9 trigeminal (B), and E16 vestibular (C) ganglion explants to NRTN. Each graph shows the average neurite outgrowth from each ganglion cultured with NRTN at concentrations ranging from 0 to 100 ng/ml for 3 d (A, B) or 5 d (C). The E9 ciliary ganglion shows a monotonic increase in neurite outgrowth in response to NRTN up to the concentration of 50 ng/ml, beyond which the magnitude of neurite outgrowth decreases. The trigeminal as well as vestibular ganglia show a monotonic increase in neurite outgrowth in response to NRTN, with a maximum outgrowth at 100 ng/ml.n = 6, 6, 6, 9, and 6 (from left, for CLG); n = 6, 9, 6, and 6 (fromleft, for TG); n = 11, 7, 6, and 8 (from left, for VG).

