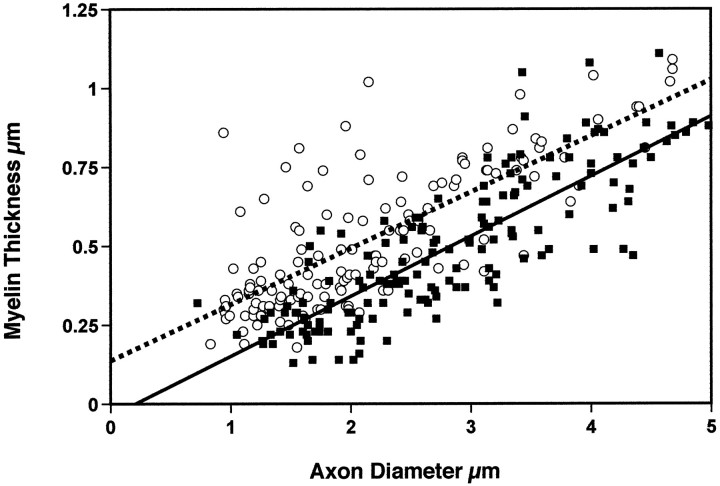
Fig. 3.
Regression analysis of myelin thickness versus the axon diameter for control (open circles, dashed line) and NGF-OE mice (filled squares, continuous line) (3 animals in each group). Note that both control and NGF-OE axons exhibit significant correlation between myelin thickness and axon diameter. However, NGF-OE mice exhibit overall a significantly thinner myelin sheath for a give axonal diameter than control mice do.

