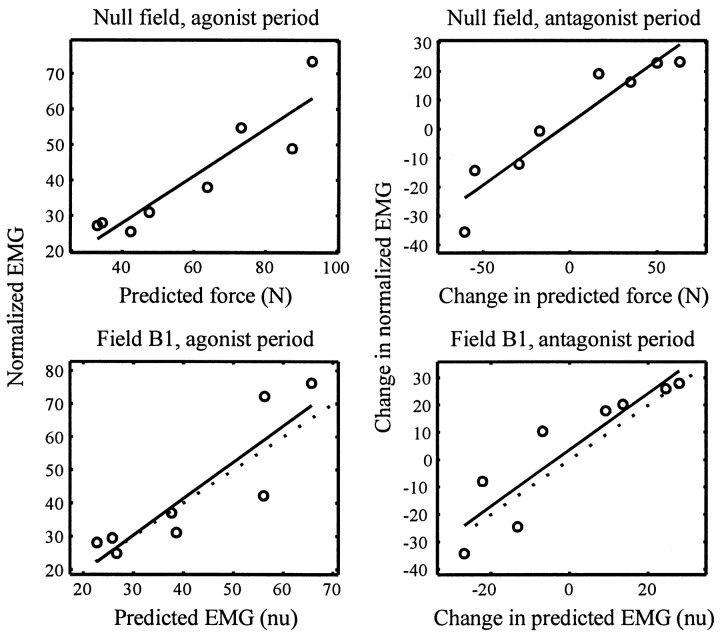
Fig. 2.
Data used for building a simple force activation model for the anterior deltoid and data used for testing the validity of the model. We fitted the predicted muscle forces (as computed by an inertial model of the arm and best estimates of moment arms) to subjects’ mean EMG while moving in the null field during the agonist period (−50–100 msec into the movement) and during the antagonist period (200–300 msec into the movement; Eq. 7 fits a line to the change in activity between the agonist and antagonist periods). The simple muscle model, as derived by the data in the null field (top row), was validated by testing how well it predicted mean EMG patterns in the force field B1 after subjects had fully adapted to it. Top plots, The anterior deltoid force predicted by the inertial model is fitted to the mean EMG recorded from subjects during null field movements. Eachpoint is data for movement to a given direction. Eachcircle is the average normalized EMG recorded during that period in this muscle from all subjects. The line is the best linear fit (p < 0.001 for each figure), that represents the muscle model. Bottom plots, Validating the muscle model. The linear fit from the null field was used to transform the predicted forces necessary for movements in fieldB1 to EMG units. The x -axis is the predicted average EMG in anterior deltoid. The circles are the mean recorded EMG in all subjects after full adaptation. Thesolid line is the muscle model’s predictions. Thedotted line is the best possible linear fit of the validation data.

