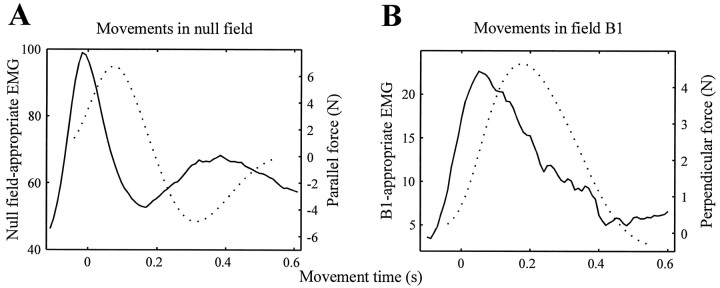
Fig. 5.
Subjects’ composite EMG traces (solid lines) and forces (dotted lines). A, Thesolid line is the null field-appropriate EMG averaged over all subjects and all movements in the initial null field set (192 movements). The dotted line is the average force in the direction of the target actually produced during the same movements. B, The solid line is theB1-appropriate EMG trace, averaged over all subjects and over all movements during the final set of training in force field B1. The dotted line is the average force produced perpendicular to the direction of target during the same movements. Forces in both plots were calculated from subject trajectories, using the model structure outlined in Equations 3and 4. For the time series of EMG and force, maximum range of 95% confidence intervals of EMG and force were as follows: null field-appropriate EMG, ±5.3 units; parallel force, ±0.28 N;B1-appropriate EMG, ±6.2 units; perpendicular force, ±0.13 N.

