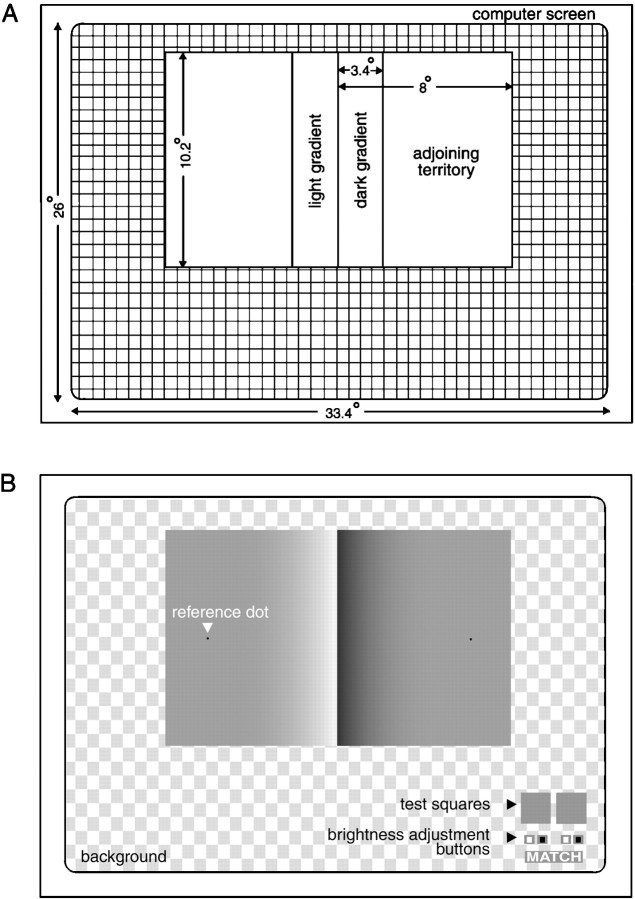
Fig. 1.
Characteristics of the test stimuli.A, Dimensions of the various elements in the standard presentation of the Cornsweet stimulus (see Fig. 2). Thecheckered area indicates the extent of the computer screen. B, The matching task performed by subjects. Thebuttons under the remote test squares at the bottom right of the screen allowed subjects to adjust these two areas to match the apparent differences in brightness between the two territories flanking the gradients in the Cornsweet stimulus. The black dots served as reminders in each presentation of the regions that were to be compared; thecheckered pattern was used to clearly distinguish the stimulus from the background.

