
Fig. 5.
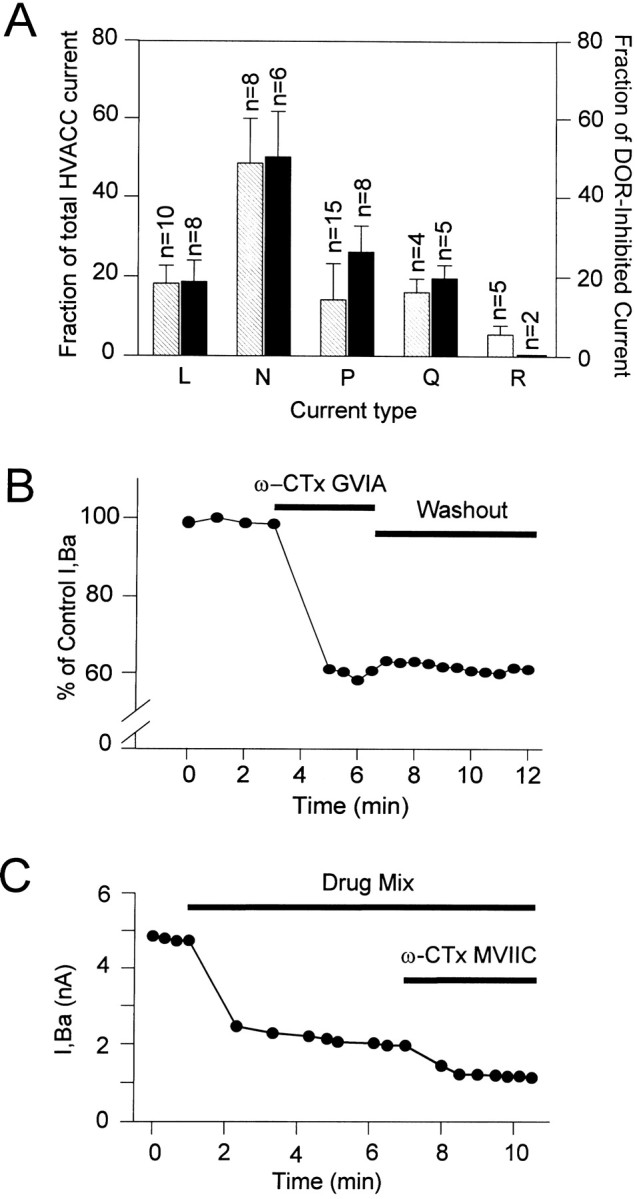
HVACC currents inhibited by toxins and targeted by DORs. A,Striped bars show the average ± SEM contributions of L-, N-, P-, and Q-type HVACC currents to the whole-cell IBa. These values were taken as equal to the percentages ofIBa inhibited by 10 μmnimodipine (L), 2 μm ω-CTx-GVIA (N), 50 nm ω-Aga-IVA (P), and 0.5–1 μm ω-CTx-MVIIC (Q), respectively. Because of its lack of selectivity, ω-CTx-MVIIC was applied after N-, P-, and L-type currents were all previously blocked. The R-type was defined as the fraction that remained unblocked in the presence of all above drugs (R) and was fully blocked by Cd2+. Solid bars show the average ± SEM contributions of each current type to the DADLE-sensitive current (ID). Notice the large contribution of the P-type current toID despite its relatively small contribution to IBa. B, Plot ofIBa versus time before and after the application of 2 μm ω-CTx-GVIA. The data points represent values of IBa at the end of 40 msec depolarizing test pulses to 0 mV from aVH of −70 mV. The ω-CTx-GVIA-induced inhibition stabilized within 2 min and was essentially irreversible (tested up to 20 min). In this neuron, the N-type current contributed 40% of IBa. To better visualize the toxin effect, the ordinate axis was truncated. Data from a medium-sized, round neuron. C, Time course from an experiment testing the contribution of the Q-type current toIBa, which was evoked with 20 msec test pulses. The L, N, and P currents contributing to the initialIBa were blocked by a combination (Drug Mix) of 10 μm nimodipine, 2 μm ω-CTx-GVIA, and 50 nm ω-Aga-IVA. The fraction subsequently inhibited by 0.5 or 1 μmω-CTx-MVIIC (1 μm in this cell) was defined as Q-type. The time course graph plots the values ofIBa at the end of the test pulses. The current remaining unblocked was defined as R-type. Data from a P-neuron. All measures made at the end of voltage test pulses to 0 mV from a VH of −70 mV.