Fig. 2.

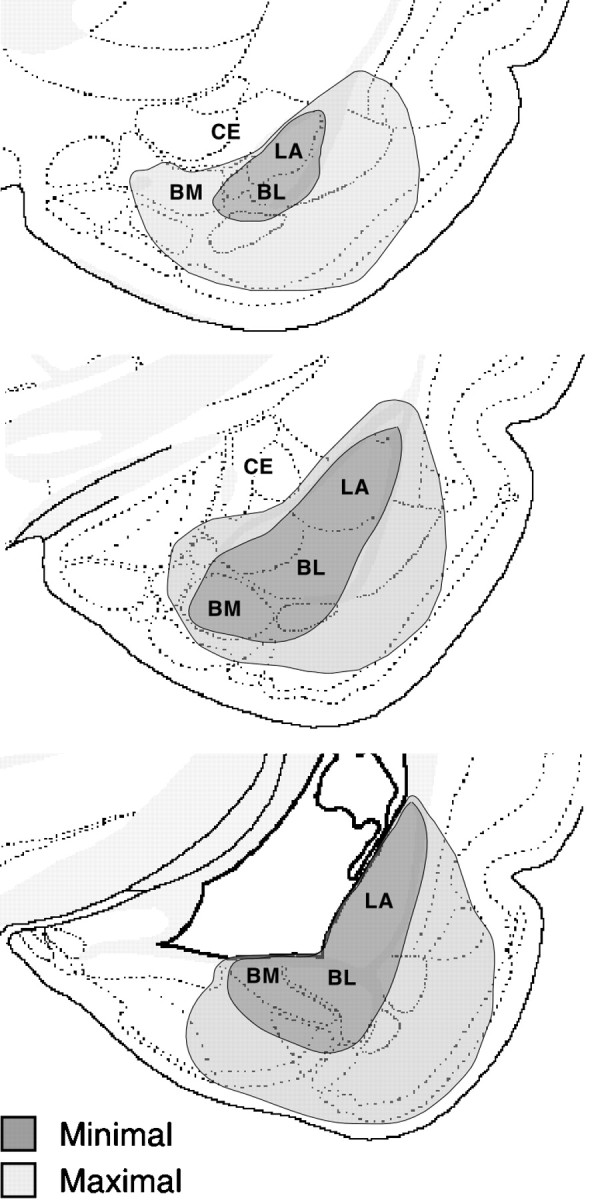
Schematic diagram illustrating the maximum (light gray) and minimum (dark gray) extents of lesions in the amygdala. In general, the lesions were confined to the lateral (LA), basolateral (BL), and basomedial (BM) nuclei.

Schematic diagram illustrating the maximum (light gray) and minimum (dark gray) extents of lesions in the amygdala. In general, the lesions were confined to the lateral (LA), basolateral (BL), and basomedial (BM) nuclei.