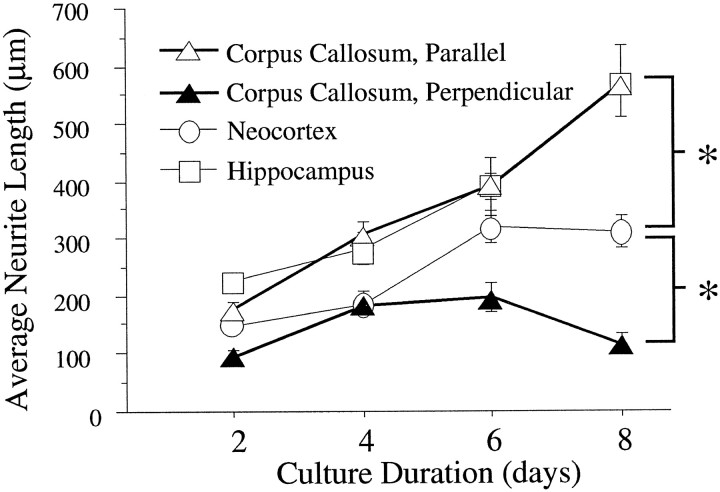
Fig. 7.
Rate of neurite outgrowth on corpus callosum, assessed both in parallel and perpendicular to the longitudinal axis, and on representative gray matter regions. After 8 d in culture, parallel neurite growth on the corpus callosum (white triangles) is comparable with that on the hippocampus (white squares) and significantly greater than neurite growth on neocortex (white circles). Neurite outgrowth on neocortex, in turn, is significantly greater than growth on the corpus callosum, assessed perpendicular to the longitudinal axis (black triangles). Values are expressed as mean ± SEM. Asterisks indicate statistical significance after 8 d in culture (p < 0.001).

