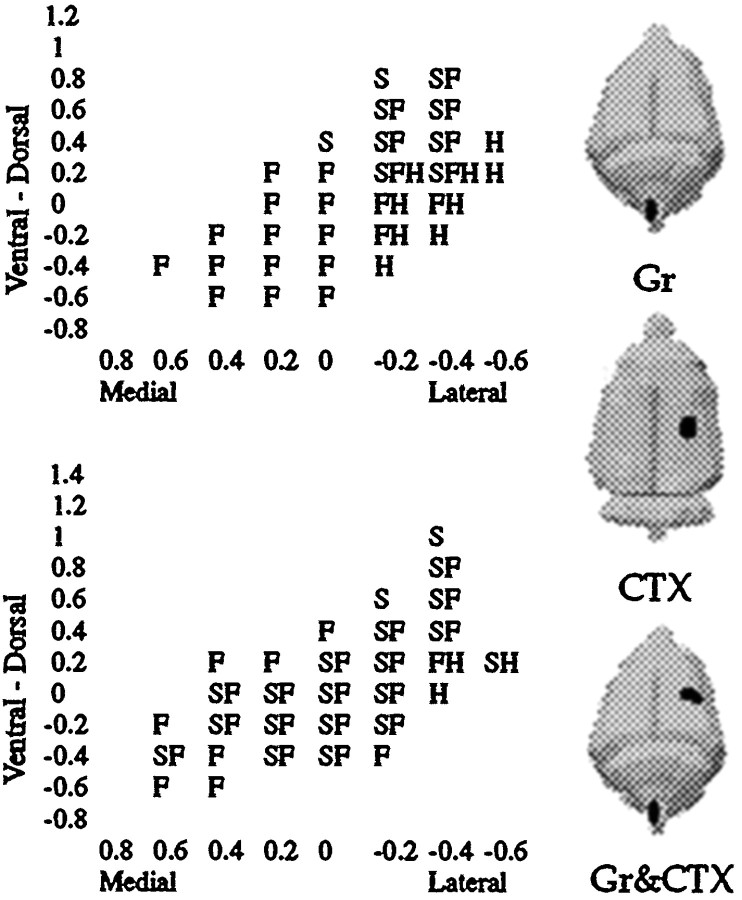
Fig. 3.
A coronal view of the VPL depicting recording sites responsive to tactile stimulation of the hindlimb, shoulder, and/or forepaw, corresponding to the row of electrode penetrations enclosed by a dashed rectangle in Figure 2. Typical data from Sham and Gr animals are shown. Three figurines illustrate three of the principal combinations of lesions used in this study and their ipsilateral and contralateral relationships.

