
Fig. 6.
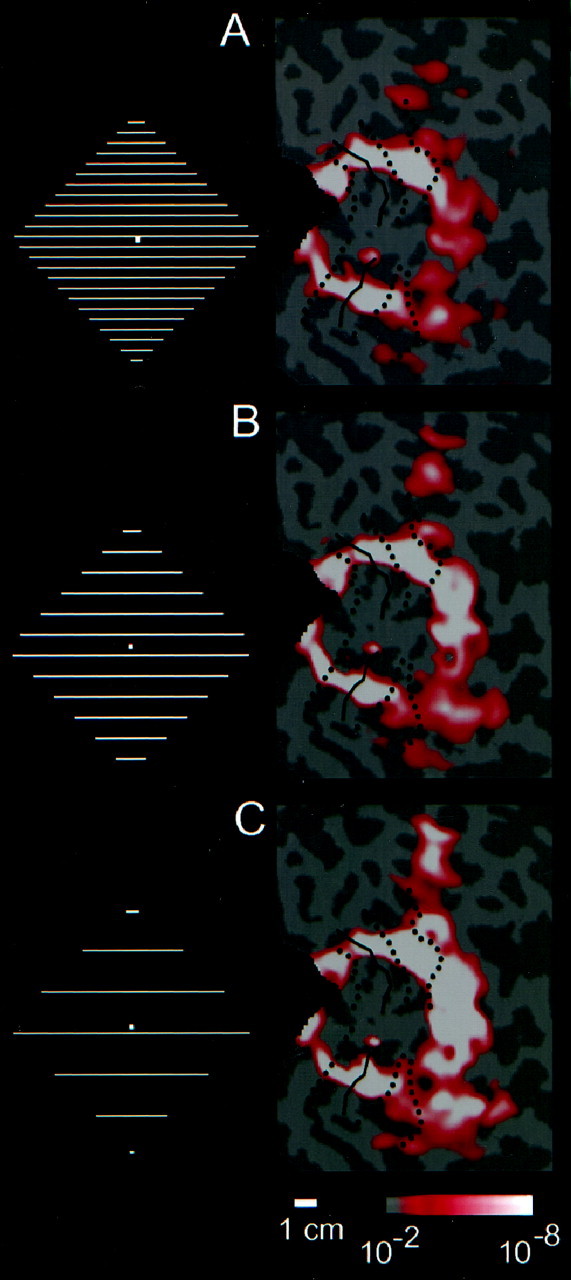
Comparison of the fMRI signal produced by grating-based illusory contours, across a range of spatial frequencies, in subject J.M. A–C show flat maps of the left occipital cortex in one subject. The activation maps are shown for three spatial frequencies. The three spatial frequencies were 2, 1, and 0.5 cycles/°. The stimulus logo next to each map shows adiamond figure, but not the stimulus background; the actual stimuli are indicated in Figure 2. Other conventions are described in previous figures. Signal strength is similar across spatial frequency in the classical retinotopic areas, but increases with decreasing spatial frequency in the lateral occiptial region anterior to (to the right of) those areas.