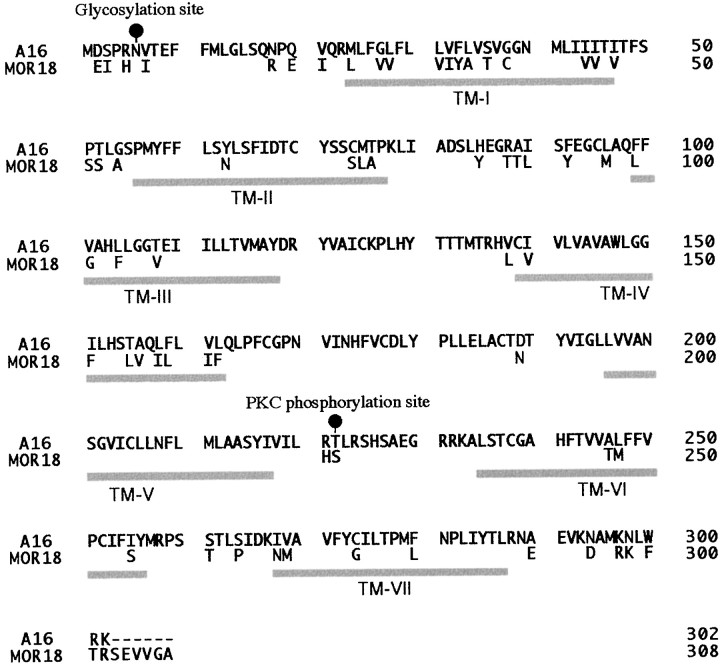
Fig. 7.
Comparison of amino acid sequences of the A16 and MOR18 proteins. The A16 sequence is shown withone-letter code, whereas only amino acid differences are indicated for the MOR18 sequence. Gray shadingrepresents conserved amino acid residues between both sequences. The predicted positions of the seven transmembrane domains (TM-I to TM-VII) are depicted below the sequences and the putative glycosylation and phosphorylation sites (black and gray circles) above the sequences.

