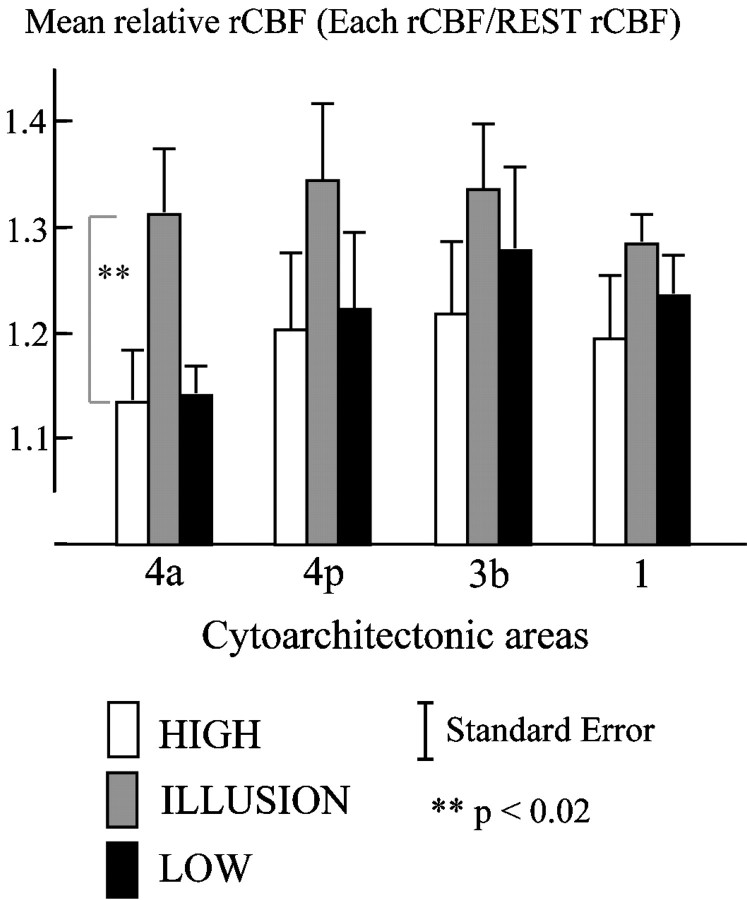
Fig. 4.
rCBF increases in areas 4a, 4p, 3b, and 1. Mean relative rCBF for VOIs of cytoarchitectural areas 4a, 4p, 3b, and 1 is shown. The VOIs were the intersections between these areas and the significant cluster from the contrast ILLUSION versus REST.White bars represent mean relative rCBF for HIGH condition; gray bars represent ILLUSION; black bars represent LOW condition. Error bars indicate SEM. The mean relative rCBF of these VOIs was then calculated for each PET scan, divided by the mean of the REST rCBF. The effect of repetition of the same condition was then removed by calculating the mean rCBF for each condition.

