
Fig. 1.
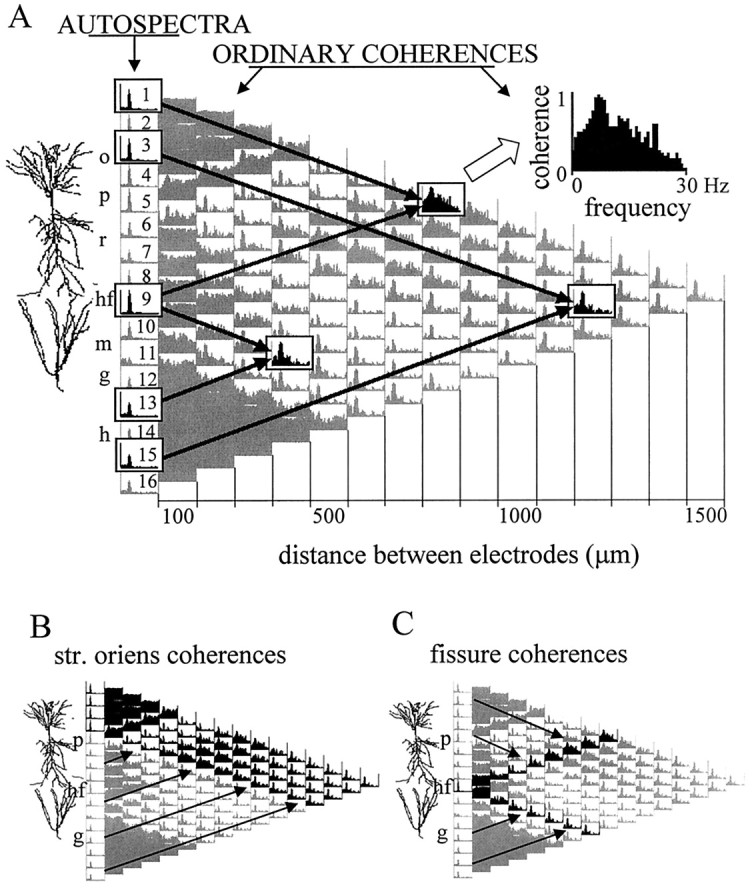
Ordinary coherence map of EEG activity and overview of data presentation. A, The 16 recording sites were equally spaced along a line between the CA1 and dentate gyrus regions. The different layers (o, str. oriens;p, pyramidal layer; r, str. radiatum;hf, hippocampal fissure; m, dentate gyrus molecular layer; g, granule cell layer;h, hilus) and the relative position of the principal cells is indicated left of the coherence map. Theleft column of the matrix shows the distribution of power (autospectrum) between 0 and 30 Hz for each signal, scaled to the channel with the highest power peak in the theta band (usually at the hippocampal fissure). The 120 pairwise coherence functions were arranged in a triangular matrix so that their position on the map indicates the location of the sites compared. Individual coherence functions for any signal pair are found at the point of crossing of arrows departing from theboxes containing the autospectra of these signals (inA, three examples are highlighted on the map). Thefirst column of coherence functions (right of the autospectra) contains 15 traces representing the relationship between neighboring signals (100 μm spacing); the second column (14 spectra) compares second neighbors (i.e., electrode tips separated by 200 μm), etc. The coherence spectrum at the peak of the triangle map connects electrodes 1 and 16 (CA1 str. oriens–alveus and dentate hilar region, respectively; 1.5 mm distance). Each coherence function spans from 0 to 30 Hz and is scaled from 0 to 1 (insert attop). B, C, Two different zones of the coherence map representing all coherence functions related to field potentials recorded at any location above the CA1 pyramidal layer (highlighted in black in B) and those related to the signal recorded from the hippocampal fissure (highlighted in black in C).