
Fig. 3.
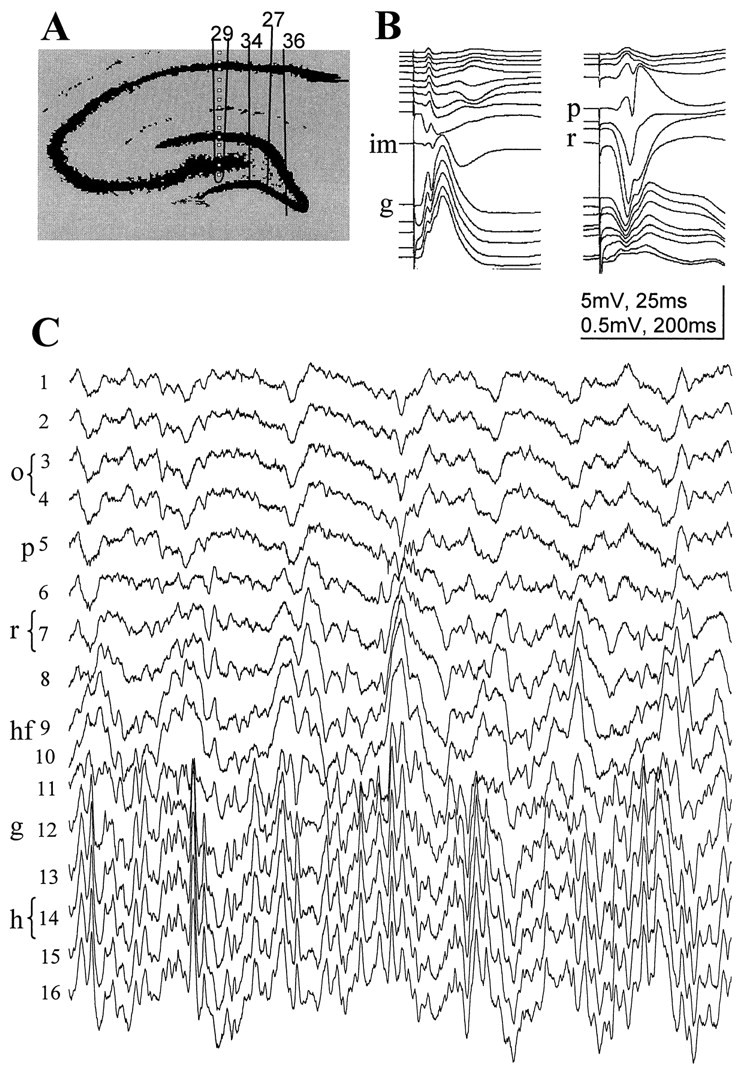
Simultaneous recording of evoked and spontaneous field activity in the CA1–dentate gyrus axis. A, Positions of the silicon probes in the rats included in this study. Thetraces shown in B and Cwere recorded with probe 29. Spacing of recording sites, 100 μm.B, Evoked field potentials in response to commissural (right) and perforant path (left) stimulation. These evoked potential profiles were used to determine the vertical location of the recording sites. C, Theta activity recorded during REM sleep. o, Str. oriens;p, pyramidal layer; r, str. radiatum;hf, hippocampal fissure; im, inner third of the molecular layer; g, granule cell layer;hi, hilus.