
Fig. 4.
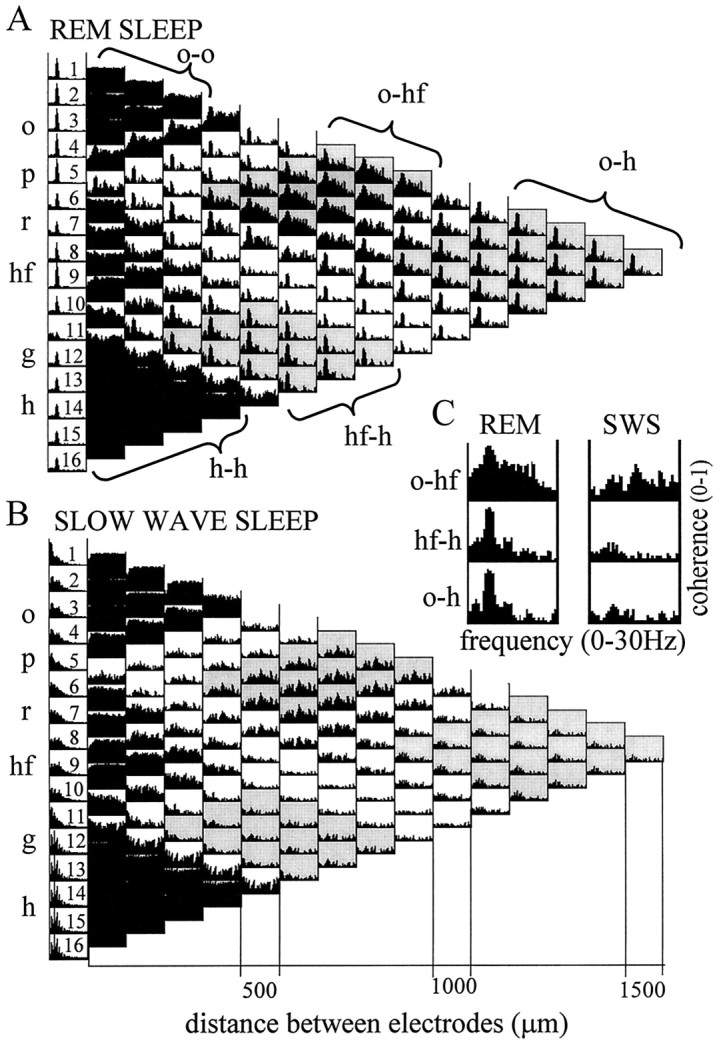
Autospectra (1–16) and maps of pairwise ordinary coherence functions computed from two 50 sec segments recorded during REM sleep (A) and SWS (B). Coherence spectra related to three major anatomical regions are highlighted: alveus–CA1 str. oriens (signals 1–4), distal dendritic regions of CA1 pyramidal cells and dentate granule cells, straddling the hippocampal fissure (8–10), and the dentate hilar region (12–16). Note similarity of the coherence functions within the respective zones. Note also that coherence functions of signals recorded within the same anatomical region showed high values over the entire 0–30 Hz frequency band (compare the threeblack triangles on the left of both maps). The three zones were separated by coherence spectra with relatively low values at all frequencies, corresponding to CA1 str. radiatum (6, 7) and dentate inner molecular layer (11) recordings. C, Pairwise coherence functions between three sample signals, recorded in different layers (o-hf, hf-h,o-h), for frequencies between 0 and 30 Hz during REM and SWS. During REM sleep, all coherence spectra were dominated by a large peak at theta frequency. Abbreviations as in Figure 1.