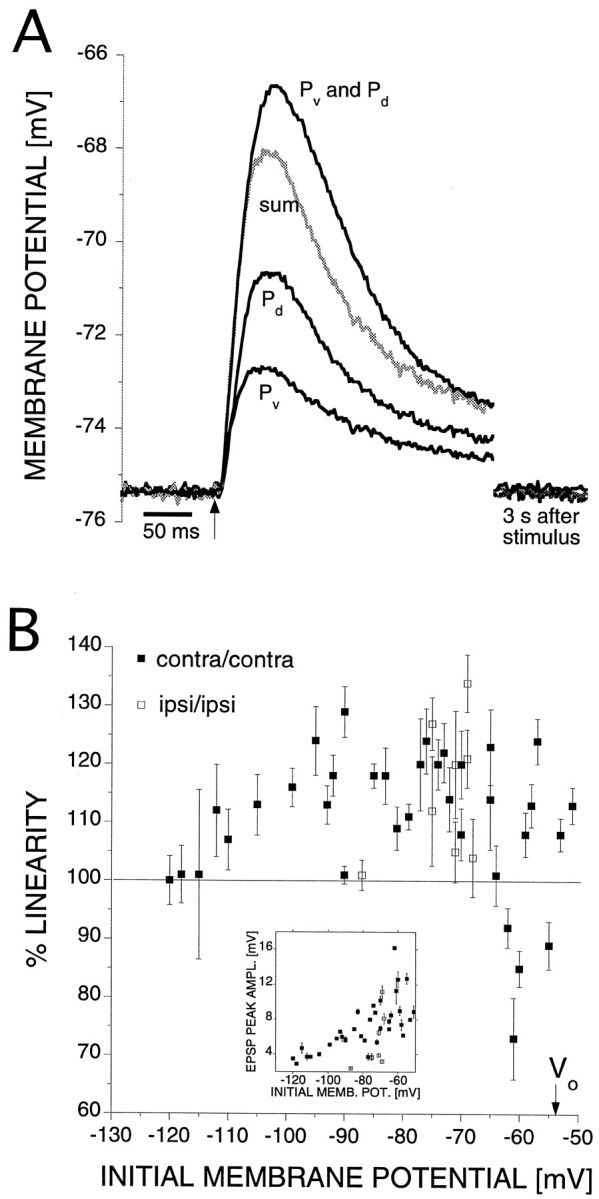
Fig. 4.

Supralinear summation of synaptic inputs from two sources. A, Averaged results from a representative AP cell (8 trials). The preparation was in a saline with high Ca2+ concentration to avoid polysynaptic pathways. The two bottom traces are the responses from individual ventral and dorsal P cell stimulation. The somata of both P cells were contralateral to the AP cell soma. In this case, the EPSP from Pv is smaller than from Pd, although the relative sizes varied in different preparations. The gray trace indicates the algebraic sum of the two EPSPs. Thetop trace is the response to simultaneous stimulation of both P cells; its peak is 122% of the algebraic sum of individual stimulation. B, Peak EPSP from simultaneous stimulation of contralateral dorsal and ventral (▪, 21 cells) or ipsilateral dorsal and ventral (■, 6 cells) P cells expressed as % of algebraic sum at different membrane potentials (mean ± SEM; 5–10 trials). The arrow indicates the zero-current membrane potentialVo. Inset, EPSP peak amplitude from simultaneous stimulation of dorsal and ventral P cells for the data points shown in the main figure, showing that the EPSP amplitudes decrease with hyperpolarization, as in Figure3B.
