Fig. 5.
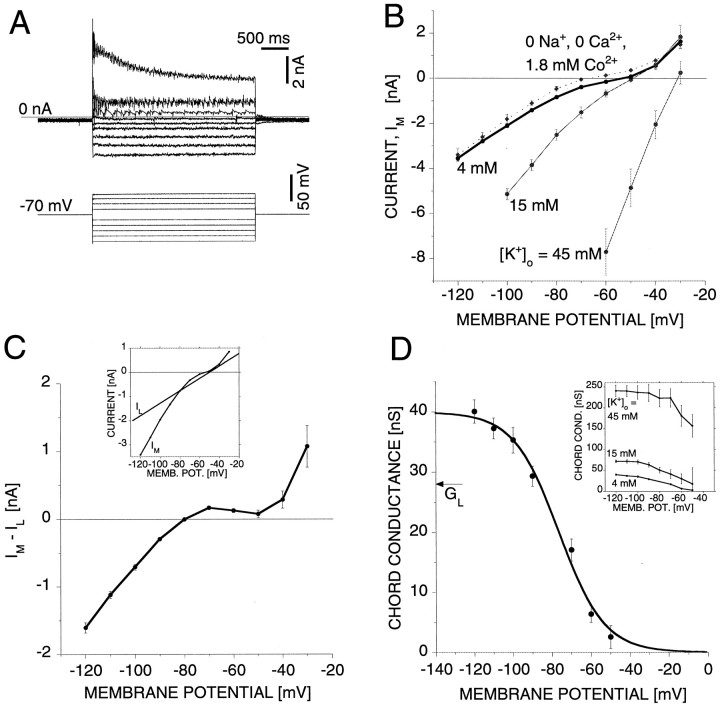
Evidence for an inward rectifier, Kir.A, Current–response (average of 9 trials) to voltage steps from a holding potential of −70 mV to various test membrane potentials between −120 and −30 mV. B, The current at the end of the 3 sec voltage step plotted versus the test membrane potential in (1) normal leech saline ([K+]o = 4 mm) (average of 8 cells), (2) 0 Na+, 0 Ca2+, 1.8 mm Co2+saline (average of 7 cells), (3) saline with [K+]o elevated to 15 (average of 6 cells), and (4) saline with [K+]oelevated to 45 mm (average of 5 cells). C, Measured current, IM, in normal saline ([K+]o = 4 mm) minus the non-K+ leak current,IL =GL(V −EL). The value of the equilibrium leak potential, EL, was assumed to be −50 mV, and the non-K+ leak conductance was estimated for each cell from the measured current,IM,EK, at the assumedEK value of −80 mV:GL =IM,EK/(EK− EL). The insetshows the measured current and the estimated non-K+leak current for one representative cell. D, Potassium chord conductance, G = (IM −IL)/(V −EK). The continuous curve is a least-squares fit of the Boltzmann equation to the data points. The fitting parameters are Gmax = 40 nS,V1/2 = −76 mV, and γ = 12 mV. For comparison the average non-K+ leak conductance,GL = 28 ± 2 nS, is indicated by the horizontal arrow. The inset shows the potassium chord conductance for [K+]o = 15 and 45 mm, estimated as described in the text. For comparison the chord conductance for [K+]o = 4 mm (i.e., the data shown in the graph) is replotted in the inset.

