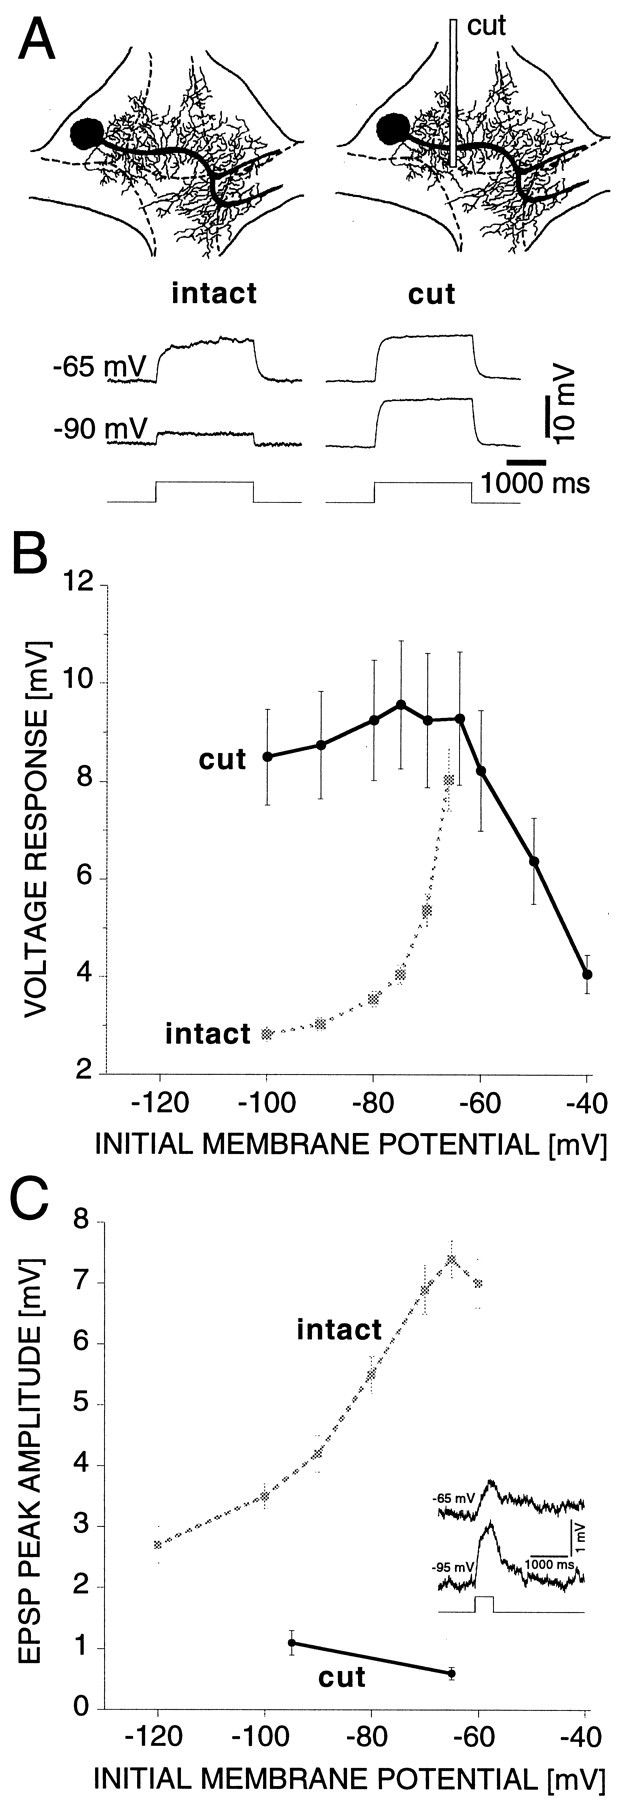
Fig. 6.

Inhomogeneous spatial distribution of the Kir channels. A, Top, Schematic diagram of the AP cell in an intact (left) and surgically cut (right) ganglion. The location of the cut is indicated by the rectangle. Bottom, Voltage responses to +0.2 nA, 2000 msec current pulses at different initial membrane potentials for the intact (left) and cut (right) AP cell in normal saline. B, Average steady-state voltage responses to +0.2 nA, 2000 msec current pulses versus initial membrane potential for intact (gray, 10 cells) and cut (black, 11 cells) AP cells. The voltage response does not increase with depolarization in the cut cell, indicating a lack of Kir channels ipsilateral to the cut.C, Inset, EPSPs in response to stimulation of the synaptic input remaining after the cut (average of 8 trials alternating between a membrane potential of −65 and −95 mV). The presynaptic ipsilateral P cells were stimulated with +4 nA, 500 msec current pulses initiating an average of 20 spikes.C, Comparison of the voltage dependence of the EPSP peak amplitude in intact (gray, 9 cells) (Fig.2B; 10 mm Ca saline) and cut (black, 6 cells, 10 mm Ca saline) AP cells. In cut AP cells the EPSP peak amplitude decreases with depolarization. In all cases tested the EPSP peak amplitude at −65 mV was smaller than at −95 mV. On average the EPSP peak amplitude at −65 mV was 55 ± 4% of the amplitude at −95 mV.
