
Fig. 2.
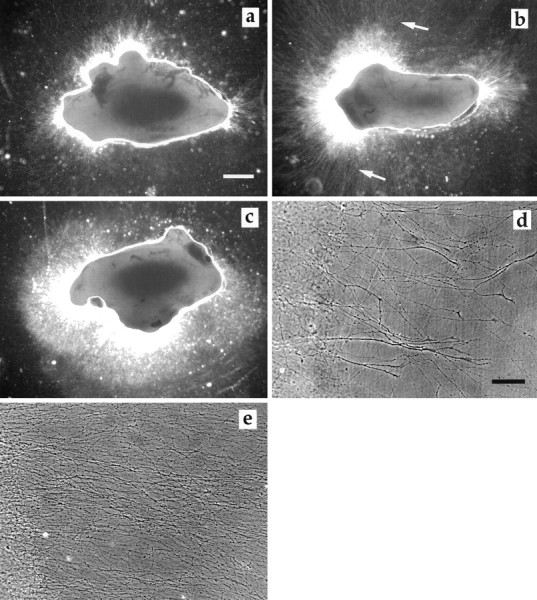
SCG cultured 72 hr. a, SCG control.b, SCG exposed to VEGF (50 ng/ml). Note the increase in the number and density of long axons (arrows).c, SCG cultured in the presence of NGF (50 ng/ml). The high density of axons is obvious, but there are only few long axons.d, SCG control, 6 d in culture, axons with growth cones emerging from the Matrigel. e, SCG exposed to VEGF (50 ng/ml), axons at the same distance from the ganglia as in the control. Note the density of axons. To be able to illustrate both ganglia and axons, the area surrounding the ganglia was subjected to enhancement of contrast in Adobe Photoshop 3.0. Ina–c, the ganglia were photographed in an inverted phase-contrast microscope using the 10× phase-contrast ring to the 4× objective, giving rise to a dark-field effect. Ind and e, conventional phase-contrast microscopy was used. Scale bars: a, 300 μm;d, 70 μm.