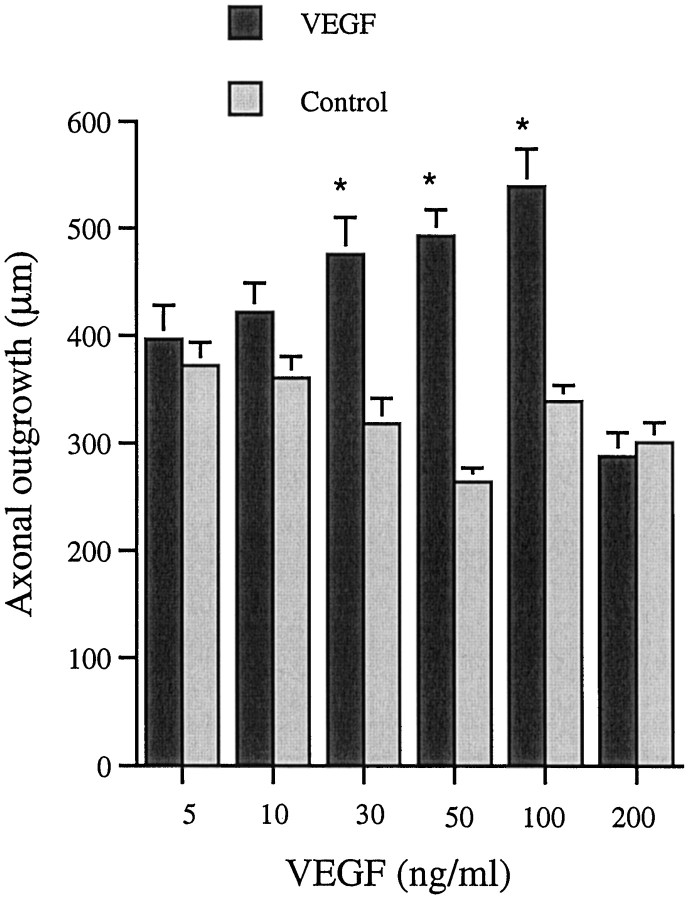
Fig. 3.
Axonal outgrowth from DRG at 48 hr. Values are mean + SEM. For this study six animals were used per concentration tested, and six measurements were performed on each ganglia. The experiment was repeated three times (n = 6 × 6), except for the concentrations 5 and 200 ng/ml, which were repeated twice with ganglia from five animals (n = 6 × 5). Student’s t test was used to calculate significant differences. *p < 0.05 compared with untreated contralateral ganglia.

