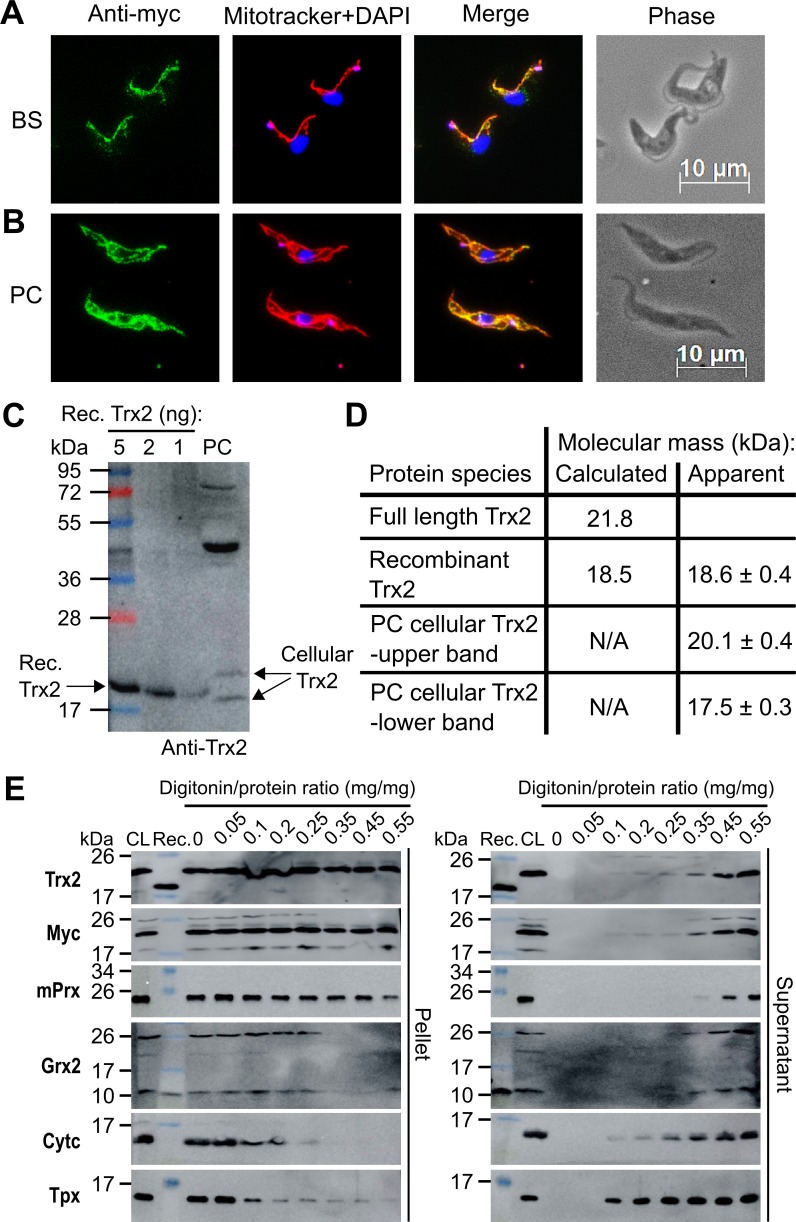
Fig 1. Subcellular localisation, expression level and molecular mass of mature Trx2 in T. brucei.
Immunofluorescence microscopy of (A) BS T. brucei 2T1 cells ectopically expressing WT-Trx2 and (B) PC WT-Trx2 cKO cells using anti-myc antibodies (green). The mitochondrion was stained with MitoTracker (red) and the kinetoplast (small dot) and nucleus (large dot) with DAPI (blue). Merge, overlay of the three signals. Phase, phase contrast image. (C) Representative comparative Western blot using different amounts of recombinant (Rec.) Trx2, total lysate of 1 x 10⁷ PC T. brucei cells (PC), Page Ruler Plus for standardization and Image J for quantification. In the cell lysate, the Trx2 antibodies detected two protein species that run above and below the recombinant protein. The bands with masses > 40 kDa are proteins that cross-react with the polyclonal antiserum (see also Figs 2A and 3A). (D) Calculated and apparent molecular masses of the Trx2 species as derived from Western blot analyses using both PageRuler Plus and DualColor as standards. The values are the mean ± standard deviation (SD) derived from four independent analyses. (E) PC WT-Trx2 cKO cells were treated with increasing digitonin/protein ratios. Pellet and supernatant fractions were subjected to Western blot analyses alongside recombinant Trx2 or Grx2 (Rec.) and total cell lysate (CL). Grx2 and cytochrome c (Cytc) served as markers for the mitochondrial IMS, and Tpx and mPrx for the cytosol and the mitochondrial matrix, respectively.

