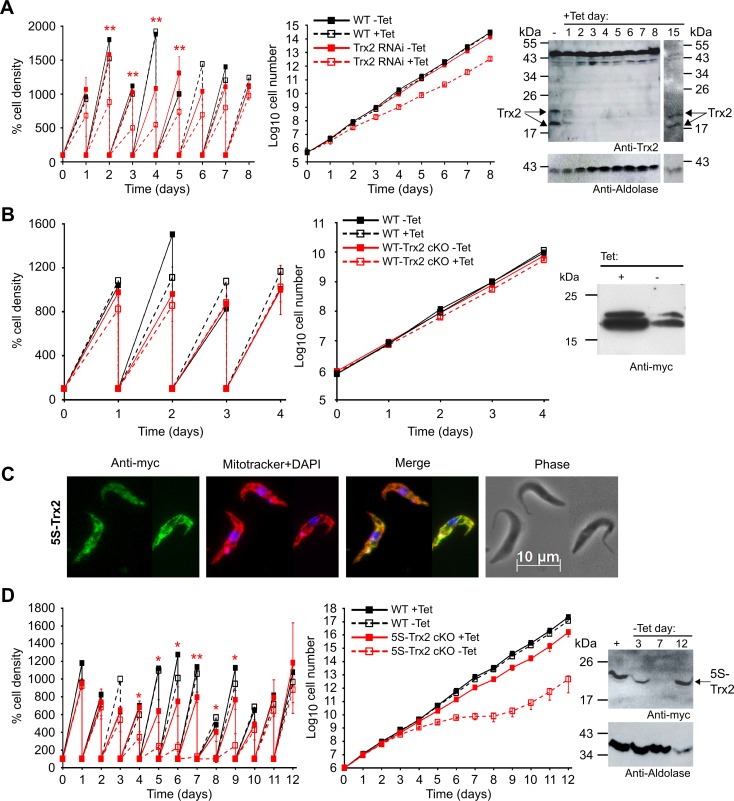
Fig 3. Analysis of Trx2 in PC T. brucei.
Tet-inducible (A) Trx2 RNAi, (B) WT-Trx2 cKO and (D) 5S-Trx2 cKO cell lines as well as WT parasites were cultured ± Tet. Every 24 h, the cells were counted and diluted back to the starting density of 5 x 10⁵ cells/ml and analyzed as outlined in the legend of Fig 2. The data are the mean standard ± SD from three distinct cell lines. All analyses were conducted in duplicate. A paired t-test was used to evaluate significant differences between non-induced and induced cell lines at each time point (* = p<0.05 and ** = p<0.01). Western blot analyses were conducted with total lysates from 1 x 10⁷ (A) Trx2-RNAi cells grown in the absence or for different times in the presence of Tet, (B) WT-Trx2 cKO cells grown in the presence or for four days in the absence of Tet and (D) 5S-Trx2 cKO cells cultured in the presence of Tet or for different times in the absence of Tet. Aldolase served as loading control. (C) Immunofluorescence microscopy of induced 5S-Trx2 cKO cells using anti-myc antibodies (green). The mitochondrion was stained with MitoTrackerRed (red) and the kinetoplast and nucleus with DAPI (blue). Merge, overlay of the three signals. Phase, phase contrast image.

