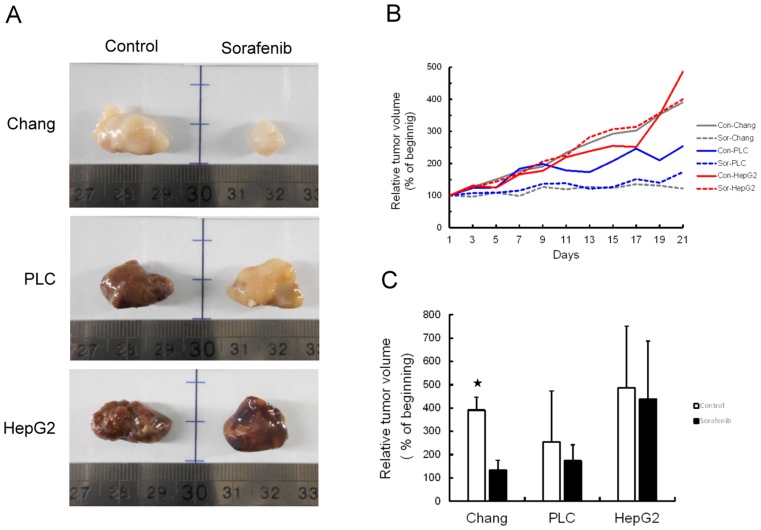
Figure 3.
Tumor growth was inhibited by sorafenib treatment in xenograft mouse model. (A) Representative images of tumors from each group with (sorafenib) or without (control) treatment in hepatoma cell xenograft tumor growth. (B) Relative tumor volume was measured every day for 21 days following treatment. (C) Statistical analysis of the efficiency of sorafenib therapy based on differences in tumor growth. *P<0.05, compared to control group.

