Figure 4.
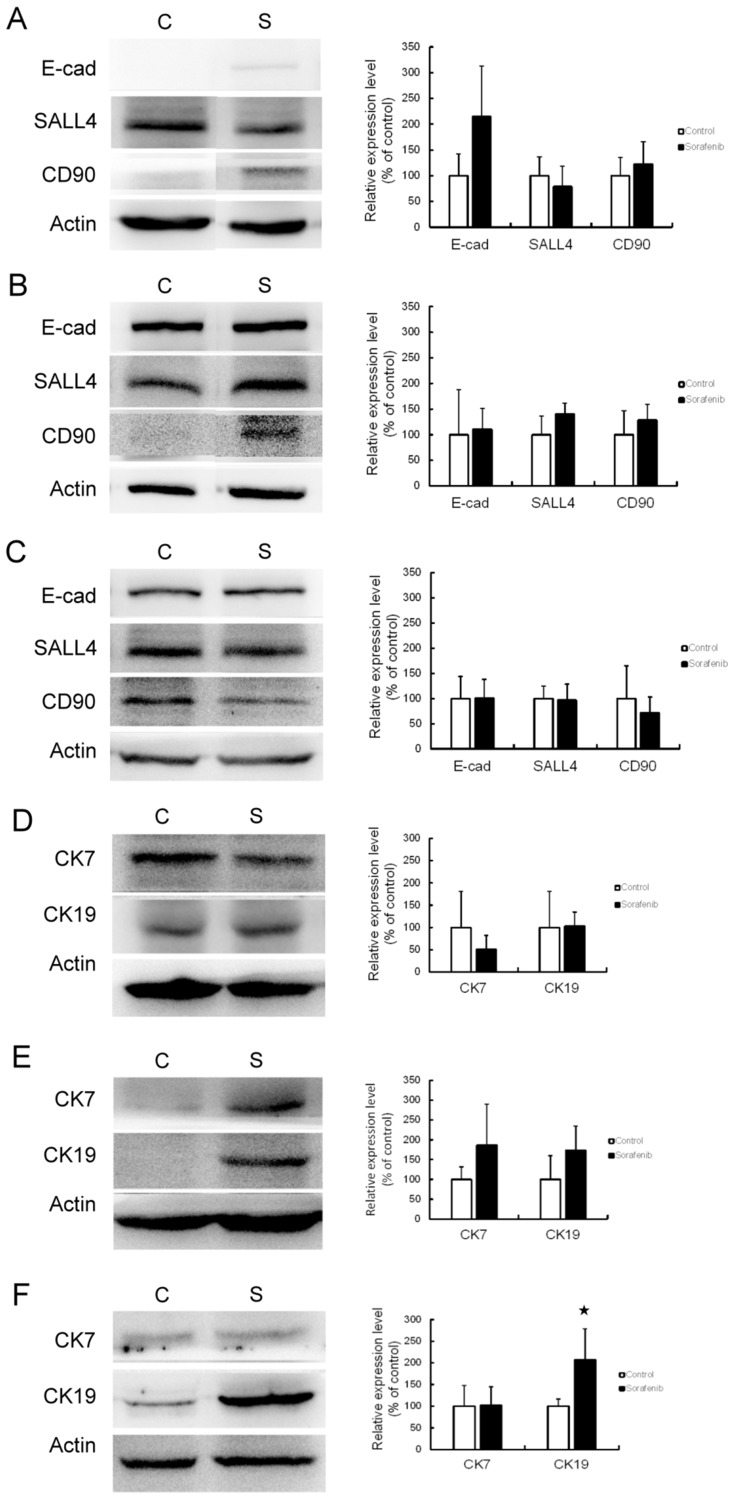
CSC marker expression was affected by sorafenib therapy in the xenograft mouse model. Western blotting (left panel) and associated statistical analysis (right panel) for the expression of E-cadherin (E-cad), SALL4, and CD90 with or without sorafenib therapy in Chang liver (A), PLC/PRF/5 (B), and HepG2 (C) xenograft tumors revealed no significant change in CSC marker expression. Western blotting (left panel) and statistical analysis (right panel) for the expression of cytokeratin 7 (CK7) and cytokeratin 19 (CK19) with or without sorafenib therapy in Chang liver (D), PLC/PRF/5 (E) and HepG2 (F) xenograft tumors also revealed no significant change, except for significantly increased CK19 expression in HepG2 xenograft tumors.
Abbreviations: C, control group; S, sorafenib treated group.

