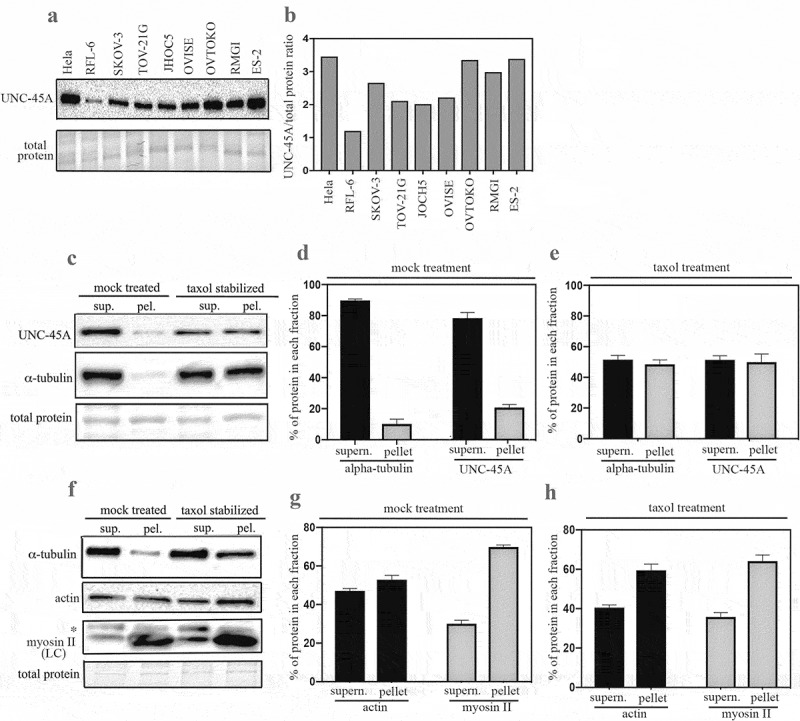
Figure 2.

UNC-45A expression levels across cell types and its fractionation with MTs in mammalian cells. a. Western blot analysis for levels of UNC-45A in the indicated cell lines. c. Quantification of UNC-45A expression levels expressed as UNC-45A/total protein ratio. c. MTs from SKOV-3 cell lines in presence or in absence (mock) of 1 μM taxol for 1 h prior ultracentrifugation. Supernatant and pellet fractions were fractionated by SDS-PAGE and subjected to Western blot analysis using anti-UNC-45A and anti-α-tubulin, antibodies. d. Quantification of % of tubulin and UNC-45A in each fraction following mock treatment. e. Quantification of % of tubulin and UNC-45A in each fraction following taxol treatment. Overall, taxol treatment resulted in an approximately fivefold increase in the amounts of tubulin and of UNC-45A found in the pellet versus mock. f. Actin and myosin II from SKOV-3 cell lines in presence or in absence (mock) of 1μM taxol for 1-h prior ultracentrifugation. Supernatant and pellet fractions were fractionated by SDS-PAGE and subjected to Western blot analysis using anti-actin and anti-myosin II antibodies. Asterisk indicates an aspecific band using a monoclonal antibody against myosin II LC. g. Quantification of % of actin and myosin II in each fraction following mock treatment. H. Quantification of % of actin and myosin II in each fraction following taxol treatment. Overall, taxol treatment resulted in a slight increase (25% after adjusting for total protein loading, which is slightly higher in the bottom last lane of Figure 2F) of actin and no increase in the amount of myosin II in the pellet fractions as compared to mock treatment.
