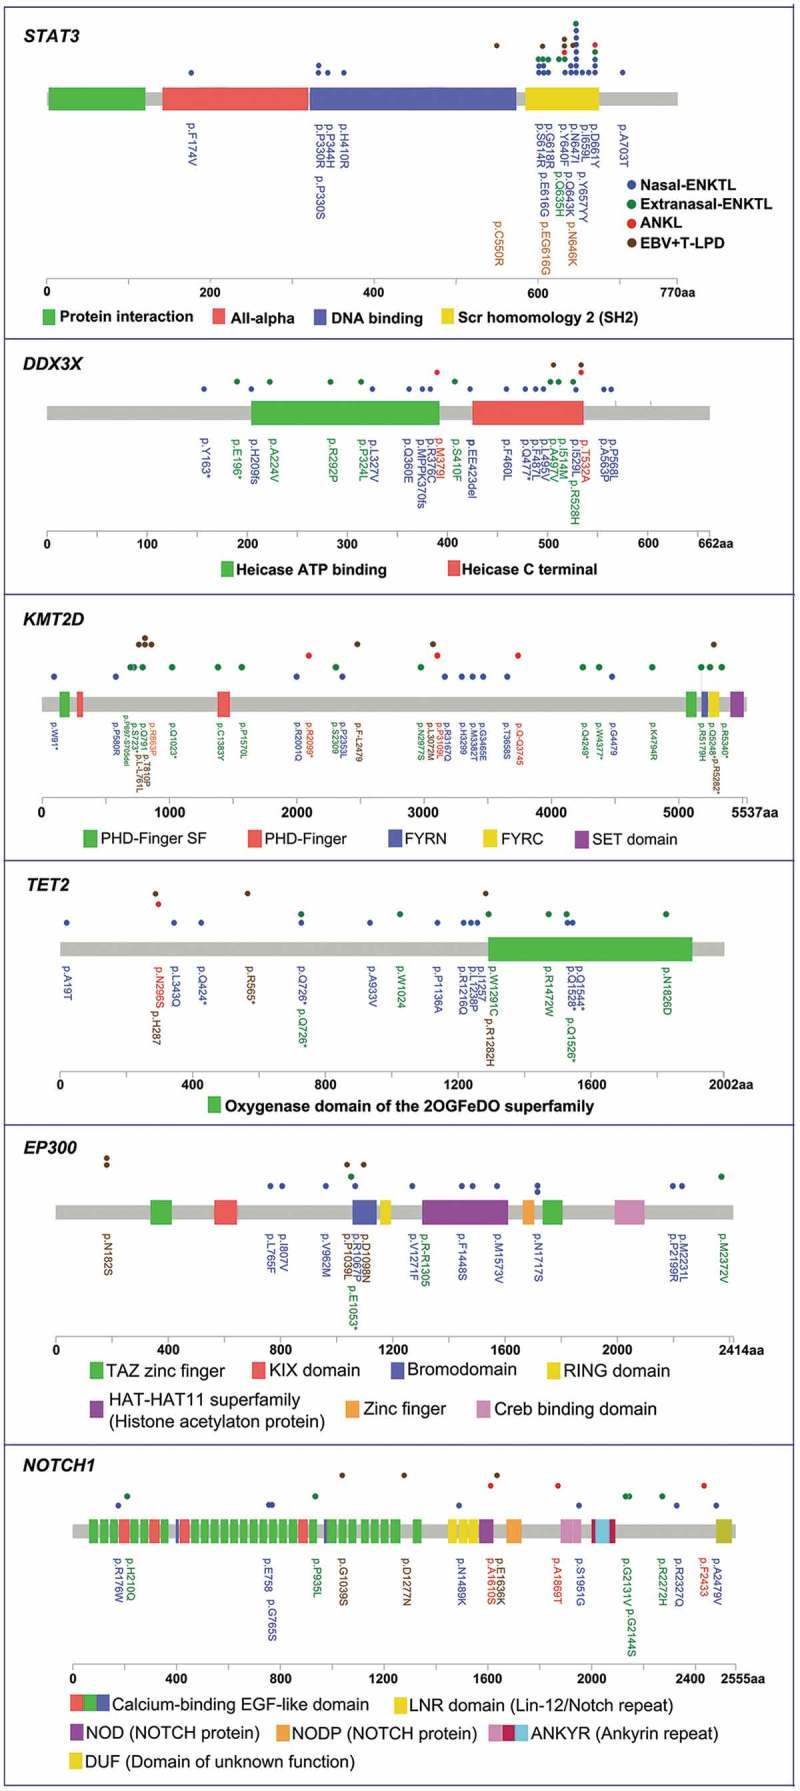
Figure 3.

The distribution of mutations in STAT3, DDX3X, KMT2D, TET2, EP300 and NOTCH1. Genomic open reading frame were labelled with amino acid positions. Colored boxes depict the different functional domains along the gene. The location of mutations is denoted by colored circles. Colors of the circles denote the EBV+T/NK-LPD subtype.
