
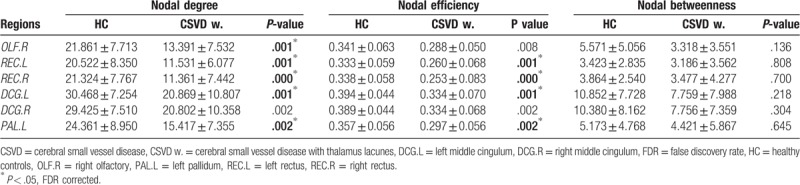
Table 3.
Regions showing decreased area under the curve values of nodal centralities in CSVD group with thalamus lacunes compared with HC participants.
Official websites use .gov
A
.gov website belongs to an official
government organization in the United States.
Secure .gov websites use HTTPS
A lock (
) or https:// means you've safely
connected to the .gov website. Share sensitive
information only on official, secure websites.
Regions showing decreased area under the curve values of nodal centralities in CSVD group with thalamus lacunes compared with HC participants.