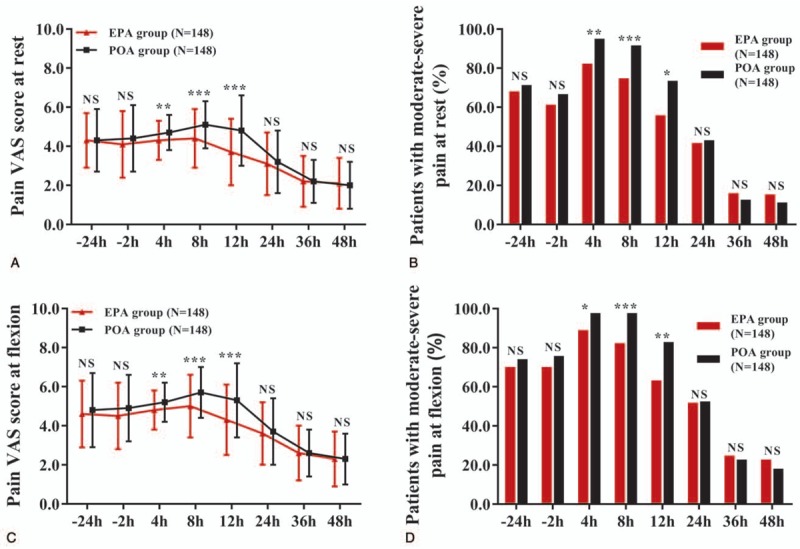
Figure 2.

Pain VAS score and severity in EPA group and POA group. EPA group presented lower pain VAS score at rest at 4, 8, and 12 h, but similar at −24, −2, 24, 36, and 48 h compared with POA group (A). EPA group exhibited decreased percentage of patients with moderate-severe pain at rest at 4, 8, and 12 h, while similar at −24, −2, 24, 36, and 48 h compared with POA group (B). EPA group presented lower pain VAS score at flexion at 4, 8, and 12 h, but similar at −24, −2, 24, 36, and 48 h compared with POA group (C). EPA group exhibited decreased percentage of patients with moderate-severe pain at flexion at 4, 8, and 12 h, while similar at −24, −2, 24, 36, and 48 h compared with POA group (D). Comparison between 2 groups was determined by the t test or Chi-square test. All repeated comparisons between 2 groups at different time points were corrected by the Bonferroni method. P < .05 was considered significant. ∗∗∗P < .001, ∗∗P < .01. AKS = arthroscopic knee surgery, EPA = early preoperative analgesia, NS = nonsignificant, POA = postoperative analgesia, VAS = visual analog scale.
