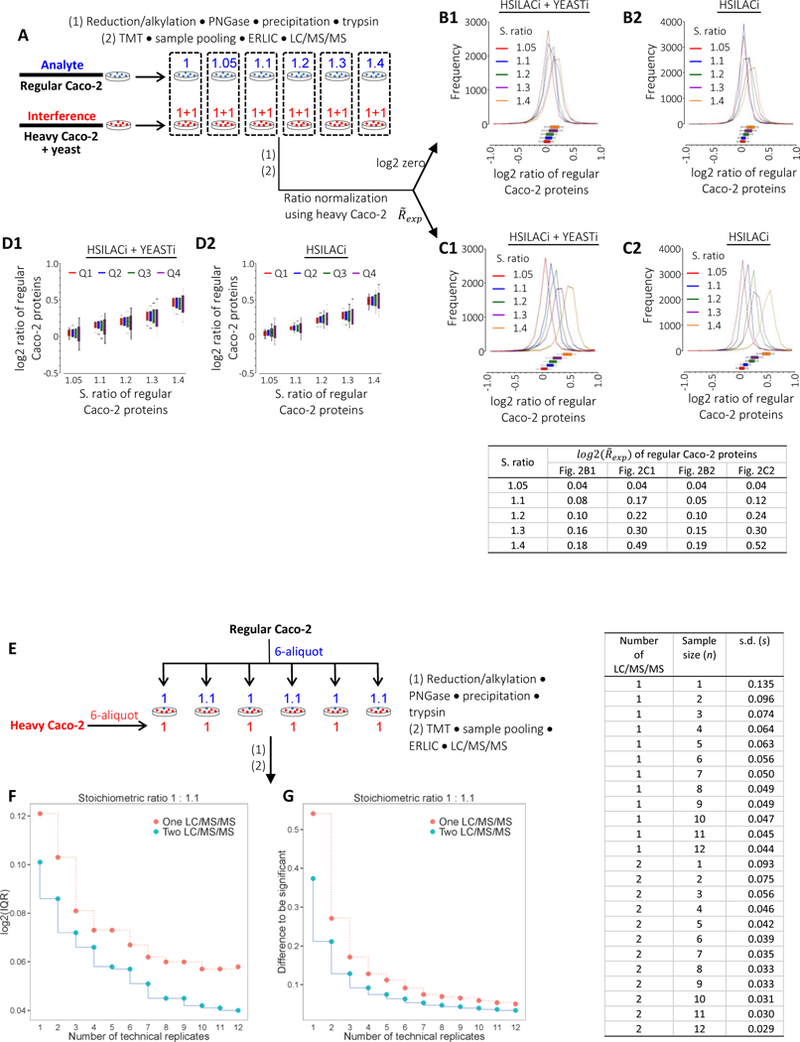
Figure 2.

Analysis of TMT ratio compression (from cell lysis to LC/MS/MS detection).
(A) Schematic representation assessing TMT ratio compression. Regular Caco-2 proteins and interfering heavy Caco-2 proteins with or without yeast were mixed at indicated stoichiometric (S.) ratios immediately after cell lysis, followed by proteomic procedures and repeated LC/MS/MS analyses. The dot frames indicate sample combinations for each 6-plex TMT channel. For simplicity, the schematic displays the interference containing both heavy Caco-2 and yeast materials. (B) Ratio distribution of regular Caco-2 proteins under HSILACi + YEASTi (B1) or HSILACi (B2) conditions. S. ratios of regular Caco-2 proteins are indicated. Ratios of regular Caco-2 proteins were normalized to median log2 zero of the equally-loaded heavy Caco-2 proteins. (C) Ratios of regular Caco-2 protein in (B) were normalized to the experimental medians of heavy Caco-2 proteins (Figure 1D), instead of median log2 zero. (D) Ratio distribution of regular Caco-2 proteins with respect to relative protein abundance. Ratios of regular protein in (C) were divided into four quartiles from high to low emPAI. HSILACi, heavy SILAC Caco-2 interference; YEASTi, yeast interference. (E) Schematic representation assessing the precision of TMT ratio with respect to the number of technical replicate under independent sample preparation. Heavy Caco-2 proteins at equal levels were mixed with regular Caco-2 proteins at stoichiometric (S.) ratios of 1 to 1.1 immediately after cell lysis, followed by analogous proteomic procedures shown in Figure 2A. (F) Corresponding IQR of protein ratios at n = 1 – 12 technical replicates with single or duplicated LC/MS/MS. (G) Differences of protein ratios to be significant with respect to the number of technical replicates at significance levels α = 0.05 and β = 0.20.
