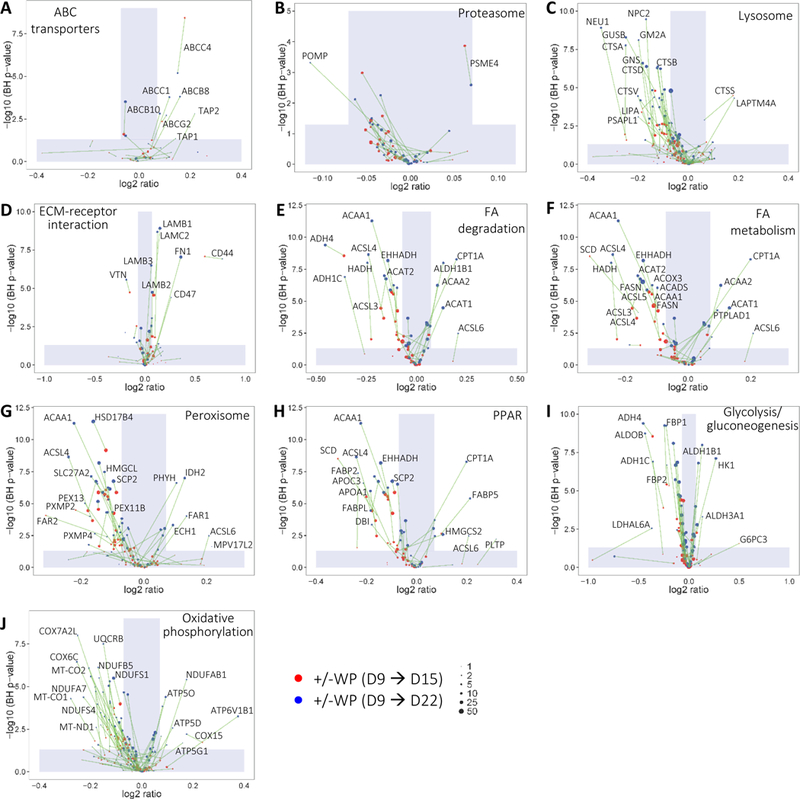
Figure 7.

Abundance changes of Caco-2 protein in KEGG pathways depicting various apical, basolateral or paracellular processes.
Cells with (+) or without (–) WP treatments were compared over D9 → D15 and D9 → D22 periods. Same proteins from the two different treatment durations are connected by solid lines. Proteins with positive or negative FCs are up- or down-regulated, respectively, under +WP conditions. (A) ABC transporters. (B) Proteasome. (C) Lysosome. (D) ECM-receptor interaction. (E) Fatty acid degradation. (F) Fatty acid metabolism. (G) Peroxisome. (H) PPAR. (I) Glycolysis/gluconeogenesis. (J) Oxidative phosphorylation. The shade defines |FC| < 1.05 or BH p-value < 0.05. ABC, ATP-binding cassette; ECM, extracellular matrix.
