. 2019 Sep 9;8:e48629. doi: 10.7554/eLife.48629

Figure 4. Suspending MTs from the surface does not aid kinesin in avoiding obstacles.

(A) Schematic of a single-molecule motility assay on MT bridges coated with QD obstacles (not to scale). (B) An example image of Cy5-labeled MT bridges in the microfabricated chamber. PDMS ridges (arrows) are visible due to the autofluorescence. (C) Mobile fraction, velocity and run length of motors along MT bridges were normalized to the no QD condition (mean ± SD, three independent experiments). From left to right, n = 199, 187, 106 for kinesin, 129, 107, 163, 135 for yeast dynein, and 192, 206, 330, 276 for DDB.

Figure 4.

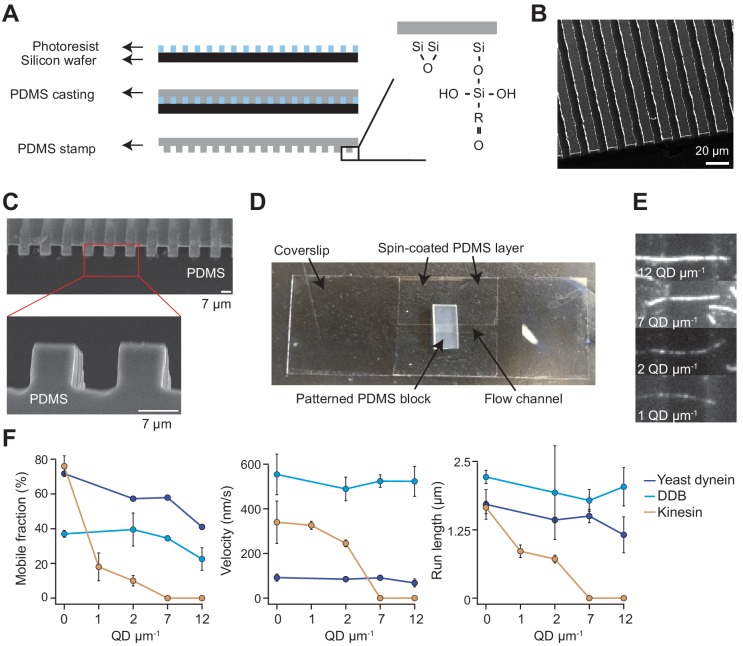
Figure 4—figure supplement 1. Chamber design and raw data of single-molecule motility along MT bridges.

Figure 4—figure supplement 1.

(A) Workflow for bridge microfabrication. The photoresist is spun and patterned on a silicon wafer. PDMS is then cast on top of the photoresist and silanized to produce a reactive surface. (B) Helium ion microscopy shows a top view of patterned PDMS. (C) Scanning electron microscopy shows the side view of patterned PDMS (top) and the zoomed view of this image reveals that the walls have sharp edges (bottom). (D) Image of the flow chamber used for experiments. (E) Example fluorescent images of QD585 obstacles on MT bridges at different QD concentrations. (F) Mobile fraction, velocity and run length of single motors on MT bridges without normalization (mean ± SD, two independent experiments). From left to right, n = 199, 187, 106 for kinesin, 129, 107, 163, 135 for yeast dynein, and 192, 206, 330, 276 for DDB.
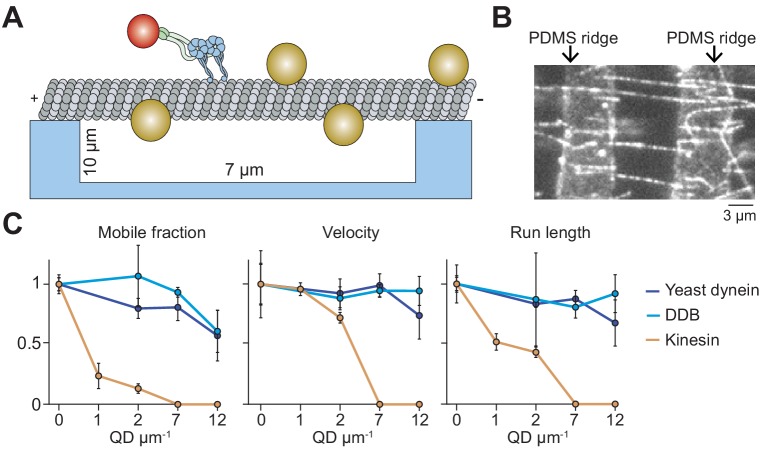
Figure 4—figure supplement 2. Kinesin pauses in the presence of QD obstacles on suspended MTs.

Figure 4—figure supplement 2.

Representative kymographs reveal frequent pauses in kinesin motility in the presence of 1 QD µm−1 on suspended MT bridges. Most pauses were permanent throughout recording.