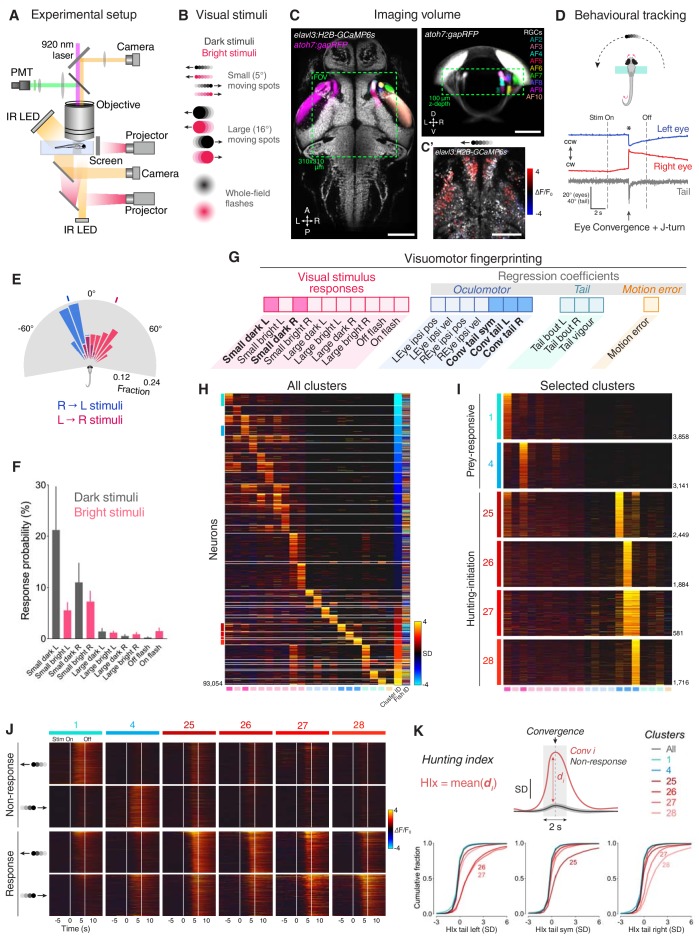
Figure 1. Neural activity associated with hunting.
(A) 2-photon GCaMP imaging combined with behavioural tracking during virtual hunting behaviour (see Materials and methods). (B) Schematic of visual stimuli. (C) elavl3:H2B-GCaMP6s;atoh7:gapRFP reference brain showing imaging volume (green box), which encompassed most retinal arborisation fields (AF2–10). In the right hemisphere, RFP has been pseudo-coloured to demarcate specific AFs. (C’) Example of neuronal activity (ΔF/F0) within one focal plane in response to a dark, leftwards moving prey-like spot (mean activity over eight presentations) overlaid onto anatomical image (grey). (D) Example of behavioural tracking data indicating hunting initiation (eye convergence and leftwards J-turn) in response to a dark, leftwards moving prey-like spot. Asterisk indicates time of convergent saccade. cw, clockwise; ccw, counter-clockwise. (E) Distribution of spot locations at time of convergent saccade. Ticks indicates median location for leftwards (blue, –18.13°, N = 162 events in eight fish) and rightwards (red, 22.10°, N = 122 events) moving spots. (F) Hunting response probability (mean + SEM, N = 8 fish) across visual stimuli. (G) Schematic of the visuomotor vector (VMV) generated for each neuron. (H) VMVs of all clustered neurons (N = 93,054 neurons from eight fish). Within each cluster, neurons are ordered according to decreasing correlation with the cluster seed centroid (mean VMV). Coloured lines on the left highlight hunting-related clusters (prey-responsive clusters in blue, hunting-initiation clusters in red). (I) Enlargement showing VMVs of selected hunting-related clusters (1, 4, 25–28). Number of cells in each cluster is shown on right. (J) Stimulus-aligned activity during non-response (top) and response (bottom) trials for neurons in selected clusters (indicated top). (K) Hunting Index (HIx). Top schematic indicates how HIx is computed from calcium signals and bottom shows distribution of HIx scores for selected clusters. Scale bars, 100 µm. A, anterior; D, dorsal; L, leftwards; P, posterior; R, rightwards; V, ventral; Sym, symmetric. See also Figure 1—figure supplements 1 and 2 and Video 1.
Figure 1—figure supplement 1. Behavioural and clustering analyses.
Figure 1—figure supplement 2. Stimulus and motor-triggered calcium responses.


