. 2019 Oct 8;8:e48114. doi: 10.7554/eLife.48114

Figure 2. AF7-pretectum contains a high density of hunting initiation neurons.

(A) Anatomical maps of prey-responsive clusters (left) and hunting-initiation clusters (middle and right). Images show dorsal views of intensity sum projections of all neuronal masks in each cluster after registration to the elavl3:H2B-GCaMP6s reference brain (grey). Insets show fraction of neurons in left and right AF7-pretectum or medial thalamus belonging to specified clusters. (B) Ventro-dorsal cross-section views of anatomical maps. (C) Visual stimulus-aligned activity during non-response trials for prey-responsive clusters (left) and hunting-initiation clusters (middle and right; mean ± SEM). Activity is displayed separately for left (blue) and right (red) hemisphere neurons in each cluster. Insets show single-trial responses for a single example cell from each cluster (mean as thick line). (D) Activity aligned to convergent saccades associated with leftwards (top), rightwards (bottom), or symmetrical/no tail movements (middle). Activity during both spontaneous and visually evoked events was used. Scale bars, 100 µm. A, anterior; D, dorsal; L, left; P, posterior; R, right; V, ventral; Stim, stimulus.

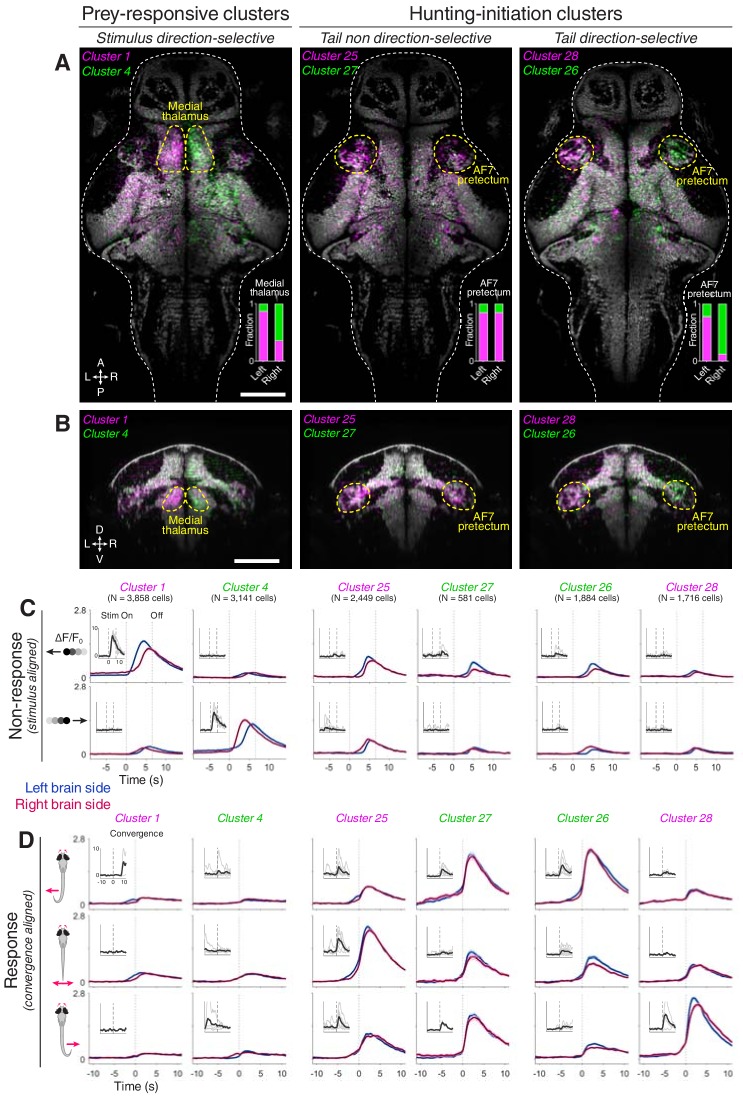
Figure 2.

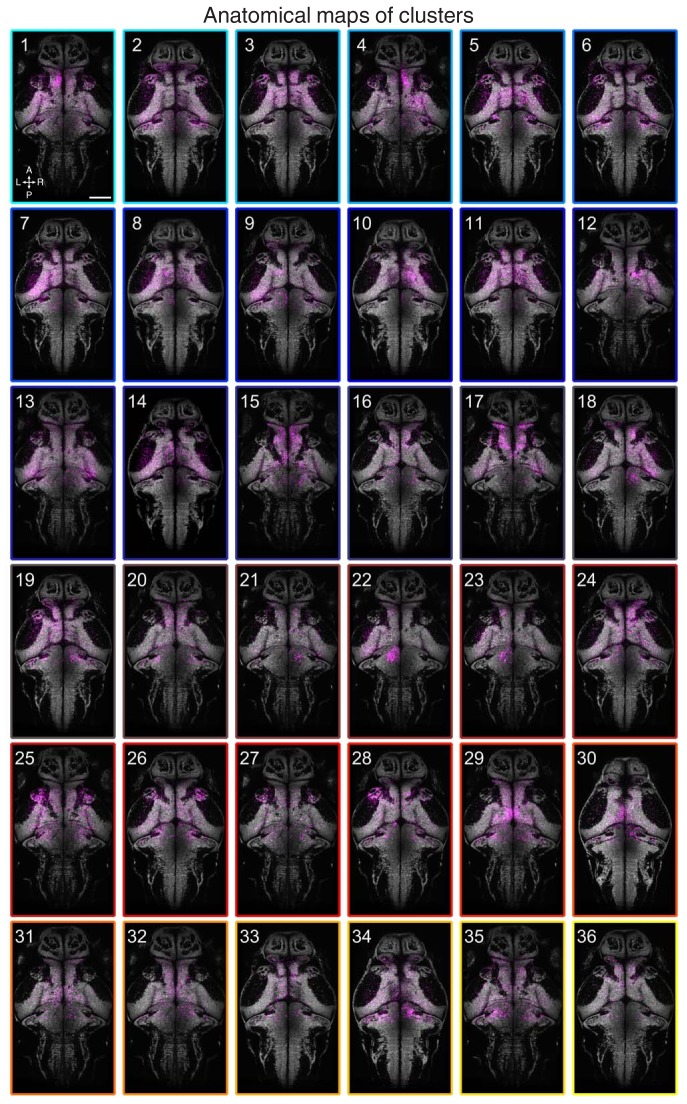
Figure 2—figure supplement 1. Anatomical maps of clusters.

Figure 2—figure supplement 1.

Images show dorsal views of intensity sum projections of all neuronal masks in each cluster (magenta) after registration to the elavl3:H2B-GCaMP6s reference brain. Projections (obtained through all focal planes,~100 µm total depth) are overlaid on a maximum-intensity projection image (grey) from the elavl3:H2B-GCaMP6s reference brain (five planes, 5 µm depth, from focal planes with the largest number of neurons in each cluster). Scale bar, 100 µm. A, anterior; L, left; P, posterior; R, right.
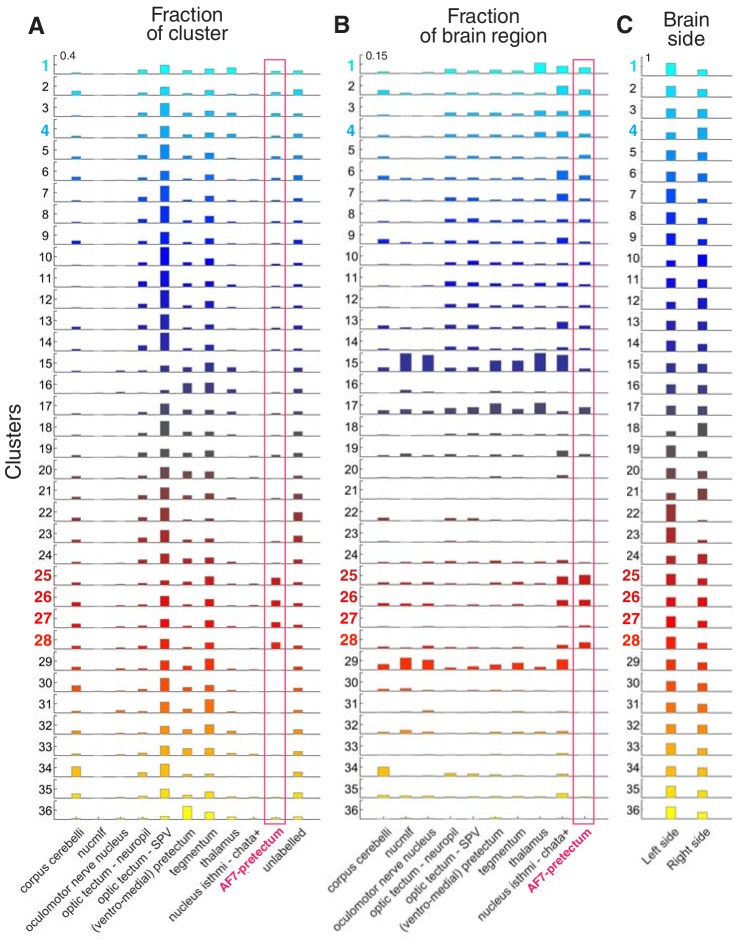
Figure 2—figure supplement 2. Anatomical locations of clustered neurons.

Figure 2—figure supplement 2.

(A) Anatomical location of clusters (N = 8 fish). The fraction of cells in each cluster falling within each ZBB anatomical region is shown. Red box highlights AF7-pretectum. Y-axis ranges from 0 to 0.4 (fraction). (B) Fraction of imaged cells within each anatomical region that were assigned to each cluster type. Red box highlights AF7-pretectum. Y-axis ranges from 0 to 0.15 (fraction of imaged neurons in brain region). (C) Fraction of neurons in each cluster located in the left or right brain hemisphere. Y-axis ranges from 0 to 1 (fraction).